


There are numerous reasons why people might visit a college campus, from visiting a school friend or seeing family, to attending a sporting event or checking the campus to see if it's the right place for them to study.
And for many, the experience of visiting a college can be an effort in itself. And something hoteliers could help with and explore when opening new properties.
In our latest study, we analyzed Booking.com listings to identify which colleges are best served by hotels and accommodation options. Given the over 1.3 million first-year applicants in 2025 [1] and their friends and families to cater to, we also determined which colleges are underserved by these options.
Key Findings:
- On average, less than one in four hotels "near" a top 100 college or university is within two miles of the campus or primary buildings.
- The vast majority of hotels offer parking to their guests, with 91% of listings "near" universities and colleges advertising the availability of parking.
- Less than half of the total accommodations listed on online travel agents (OTAs) are hotels, with just 48% of options near colleges and campuses being hotels with a rating of three stars or higher.
- The University of Hawaii at Mānoa has the highest percentage of hotels within a two-mile radius of the university.
- Yeshiva University in New York has the lowest percentage of hotels within a two-mile radius of the college campus, with the University of Chicago having the second-lowest.
Which Universities And Colleges Have The Highest Number Of Hotels "Nearby"?
Data from CommonApp showed that in 2025 alone, over 1.3 million first-year applicants sent a total of more than 8.5 million applications to colleges and universities across the country. These figures suggest that more than 8.5 million college visits, tours, or visits likely took place as well.
While some visits may be commutable from people's homes, many will be from another state or the other side of the country, requiring overnight stays and providing an opportunity for hoteliers to attract potential repeat guests, recommendations, and even workers.
To identify colleges and universities where hoteliers may be missing opportunities and visitors are underserved, we analyzed online travel agent (OTA) listings to determine the number of hotels located within a two-mile radius of college campuses or primary buildings.
Colleges Ranked By The Highest Percentage Of Hotels Within Two-Miles:
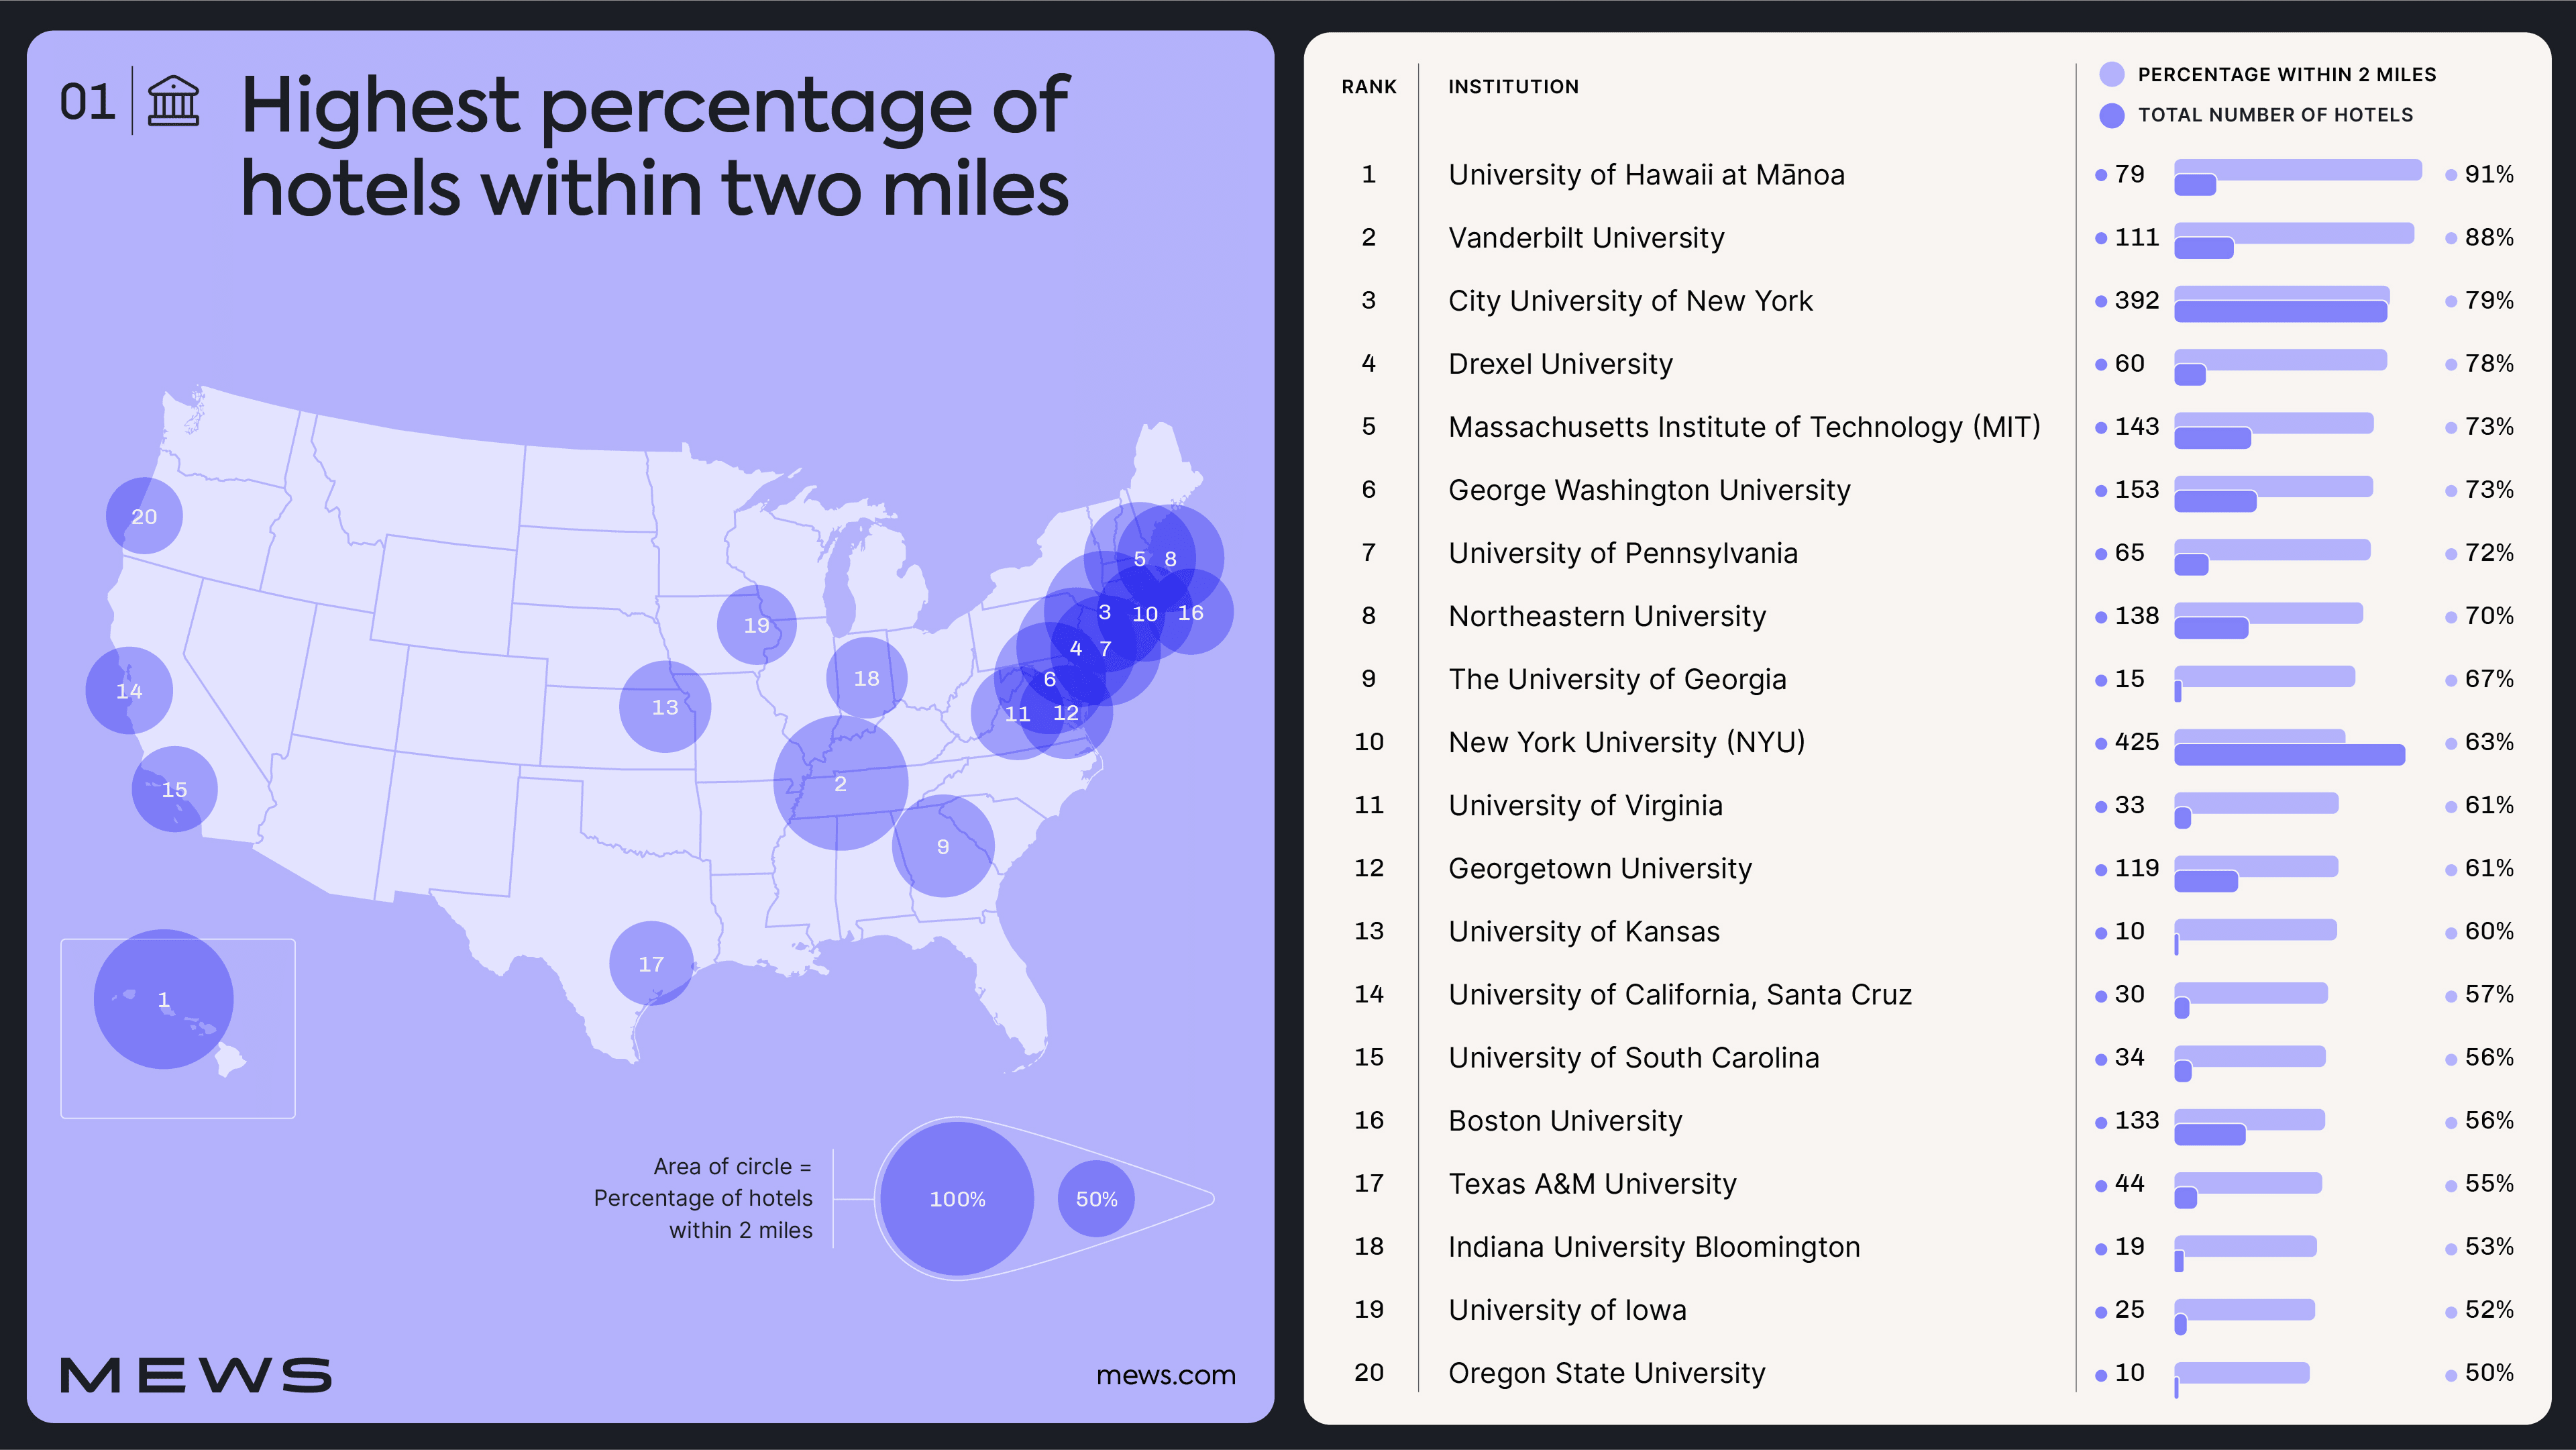
As our graphic shows, the number of three-star or higher hotels within two miles of the landmark buildings and addresses for the colleges and universities is highest at the University of Hawaii, where over 91% of the hotels are located within a two-mile radius of the university.
Vanderbilt University, in Nashville, has the second-largest percentage of hotels within a two-mile radius of its campus landmarks, with over 88% of the 111 3-star or higher hotels listed as being within a two-mile radius.
Unsurprisingly, two New York universities are in the top 10, with the City University of New York having 79% of hotels listed locally within two miles of the college landmark buildings, and New York University (NYU) having 63% of the 425 OTA listings within two miles of the university buildings.
In instances where a high percentage of hotels are located within a two-mile radius of the campus, they suggest that these hotels are in the heart of the life that many prospective students will experience, should they attend the university or college.
With this in mind, for hotels located centrally or locally to the colleges, and with fewer competitors, this offers them a real opportunity to create an attractive and informative stay for their guests, to help sell the local area and amenities, and a reason for their friends and family to stay at the hotel when visiting during the term time.
Colleges Ranked By The Highest Number Of Hotels Within Two-Miles:
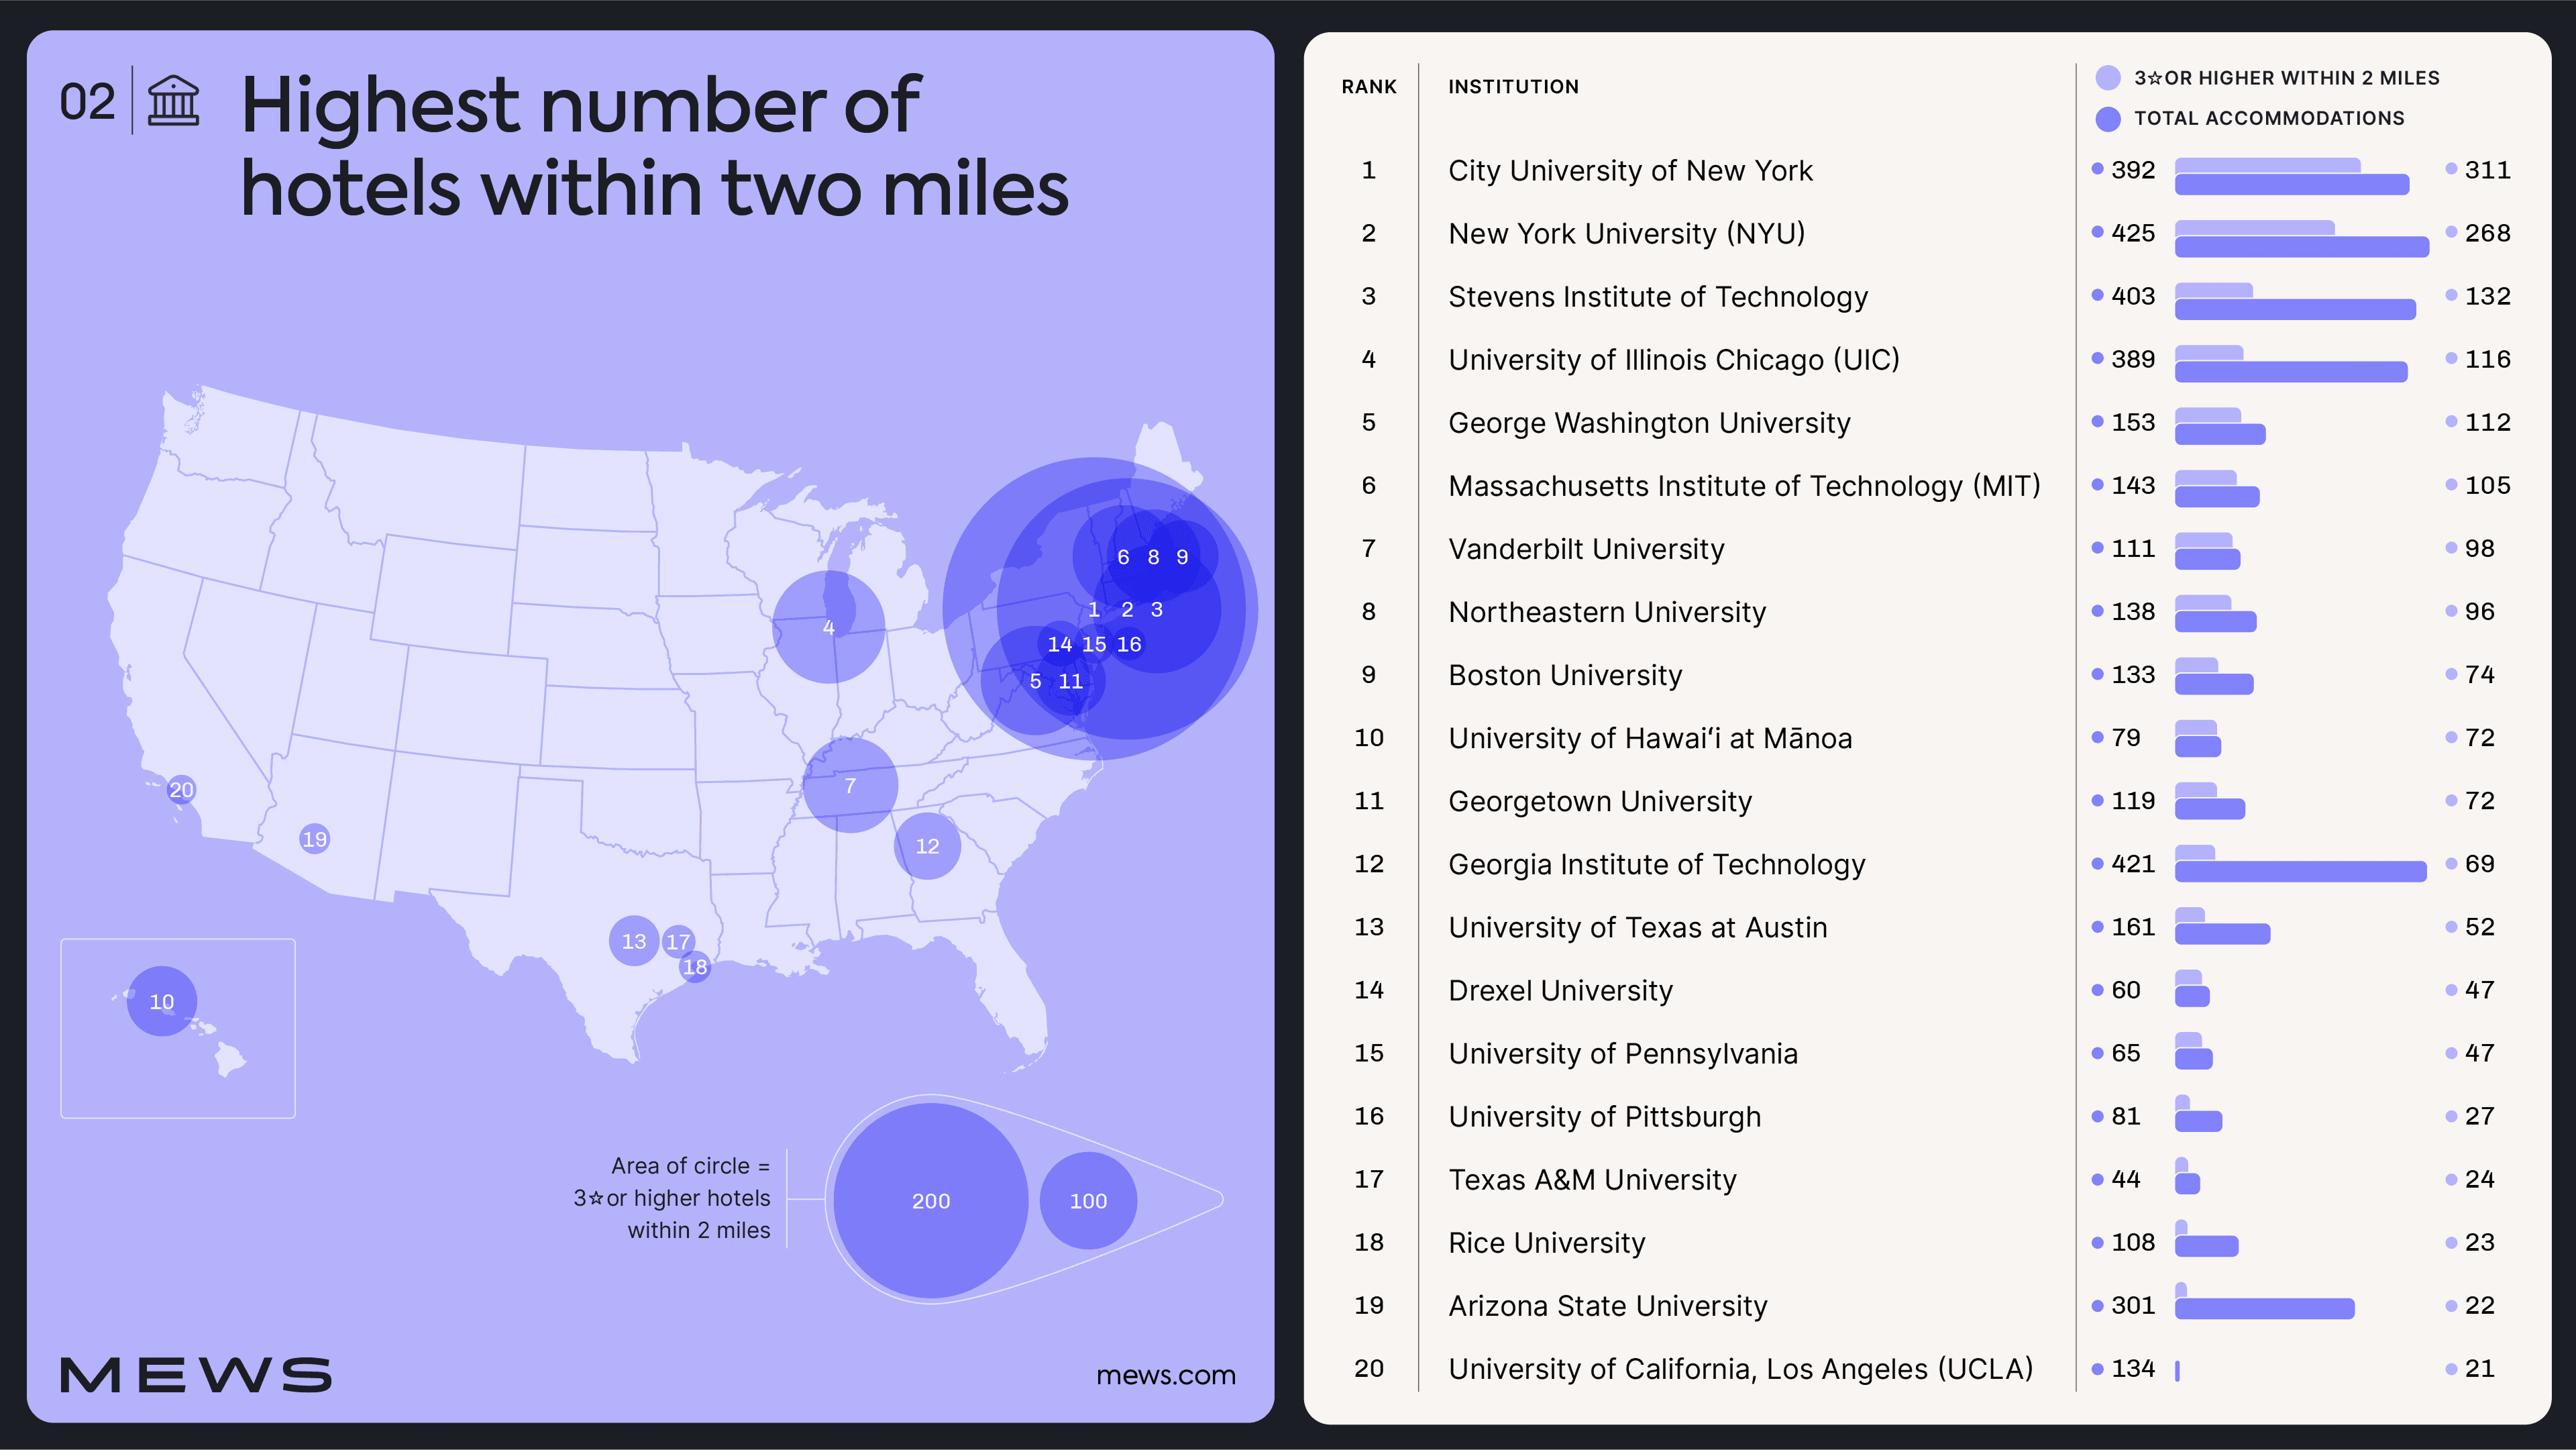
The central New York universities have (quite unsurprisingly) the highest number of hotels within two miles of their campus landmark buildings listed on OTAs. The City University of New York is found to have 311 hotels rated three stars or higher within a two-mile radius, and New York University has 268.
The Stevens Institute of Technology, located in Hoboken, has the third-highest number of three-star hotels within a two-mile radius of its campus landmark buildings, with 132. However, despite the high number of hotels located nearby, this figure accounts for only 33% of the total three, four, and five-star hotels listed on the OTA analyzed.
Away from the banks of the Hudson River and New York, the University of Illinois Chicago (UIC) has the fourth highest number of hotels with three or higher star ratings within two miles of the university's landmark buildings.
Unsurprisingly, many of the East Coast and "compact" cities have large numbers of hotels located within a two-mile radius of their local campuses. In these instances, hoteliers need to be aware of just how many competitors they are up against.
Understanding the number and variety of options that guests have to choose from can provide hoteliers with the opportunity to offer access to amenities or special offers, making themselves more attractive to prospective guests during peak campus tour and open dates.
Which Universities And Colleges Have The Least Number Of Hotels "Nearby"?
While some universities and colleges have numerous accommodation options and well-rated hotels on their doorstep, those in more rural areas or located in "college" towns and cities often have fewer choices, which is one of the motivations for the creation of the "Graduate" hotel models by some chains.
By reviewing OTA listings, we've been able to identify the colleges and universities that are the most underserved when it comes to well-rated hotels - providing an insight into where hoteliers could find potentially lucrative markets, and where guests and visitors to the colleges and universities may need to book well ahead of time, or expect to commute while visiting.
Colleges With The Lowest Number Of Hotels Within Two-Miles:
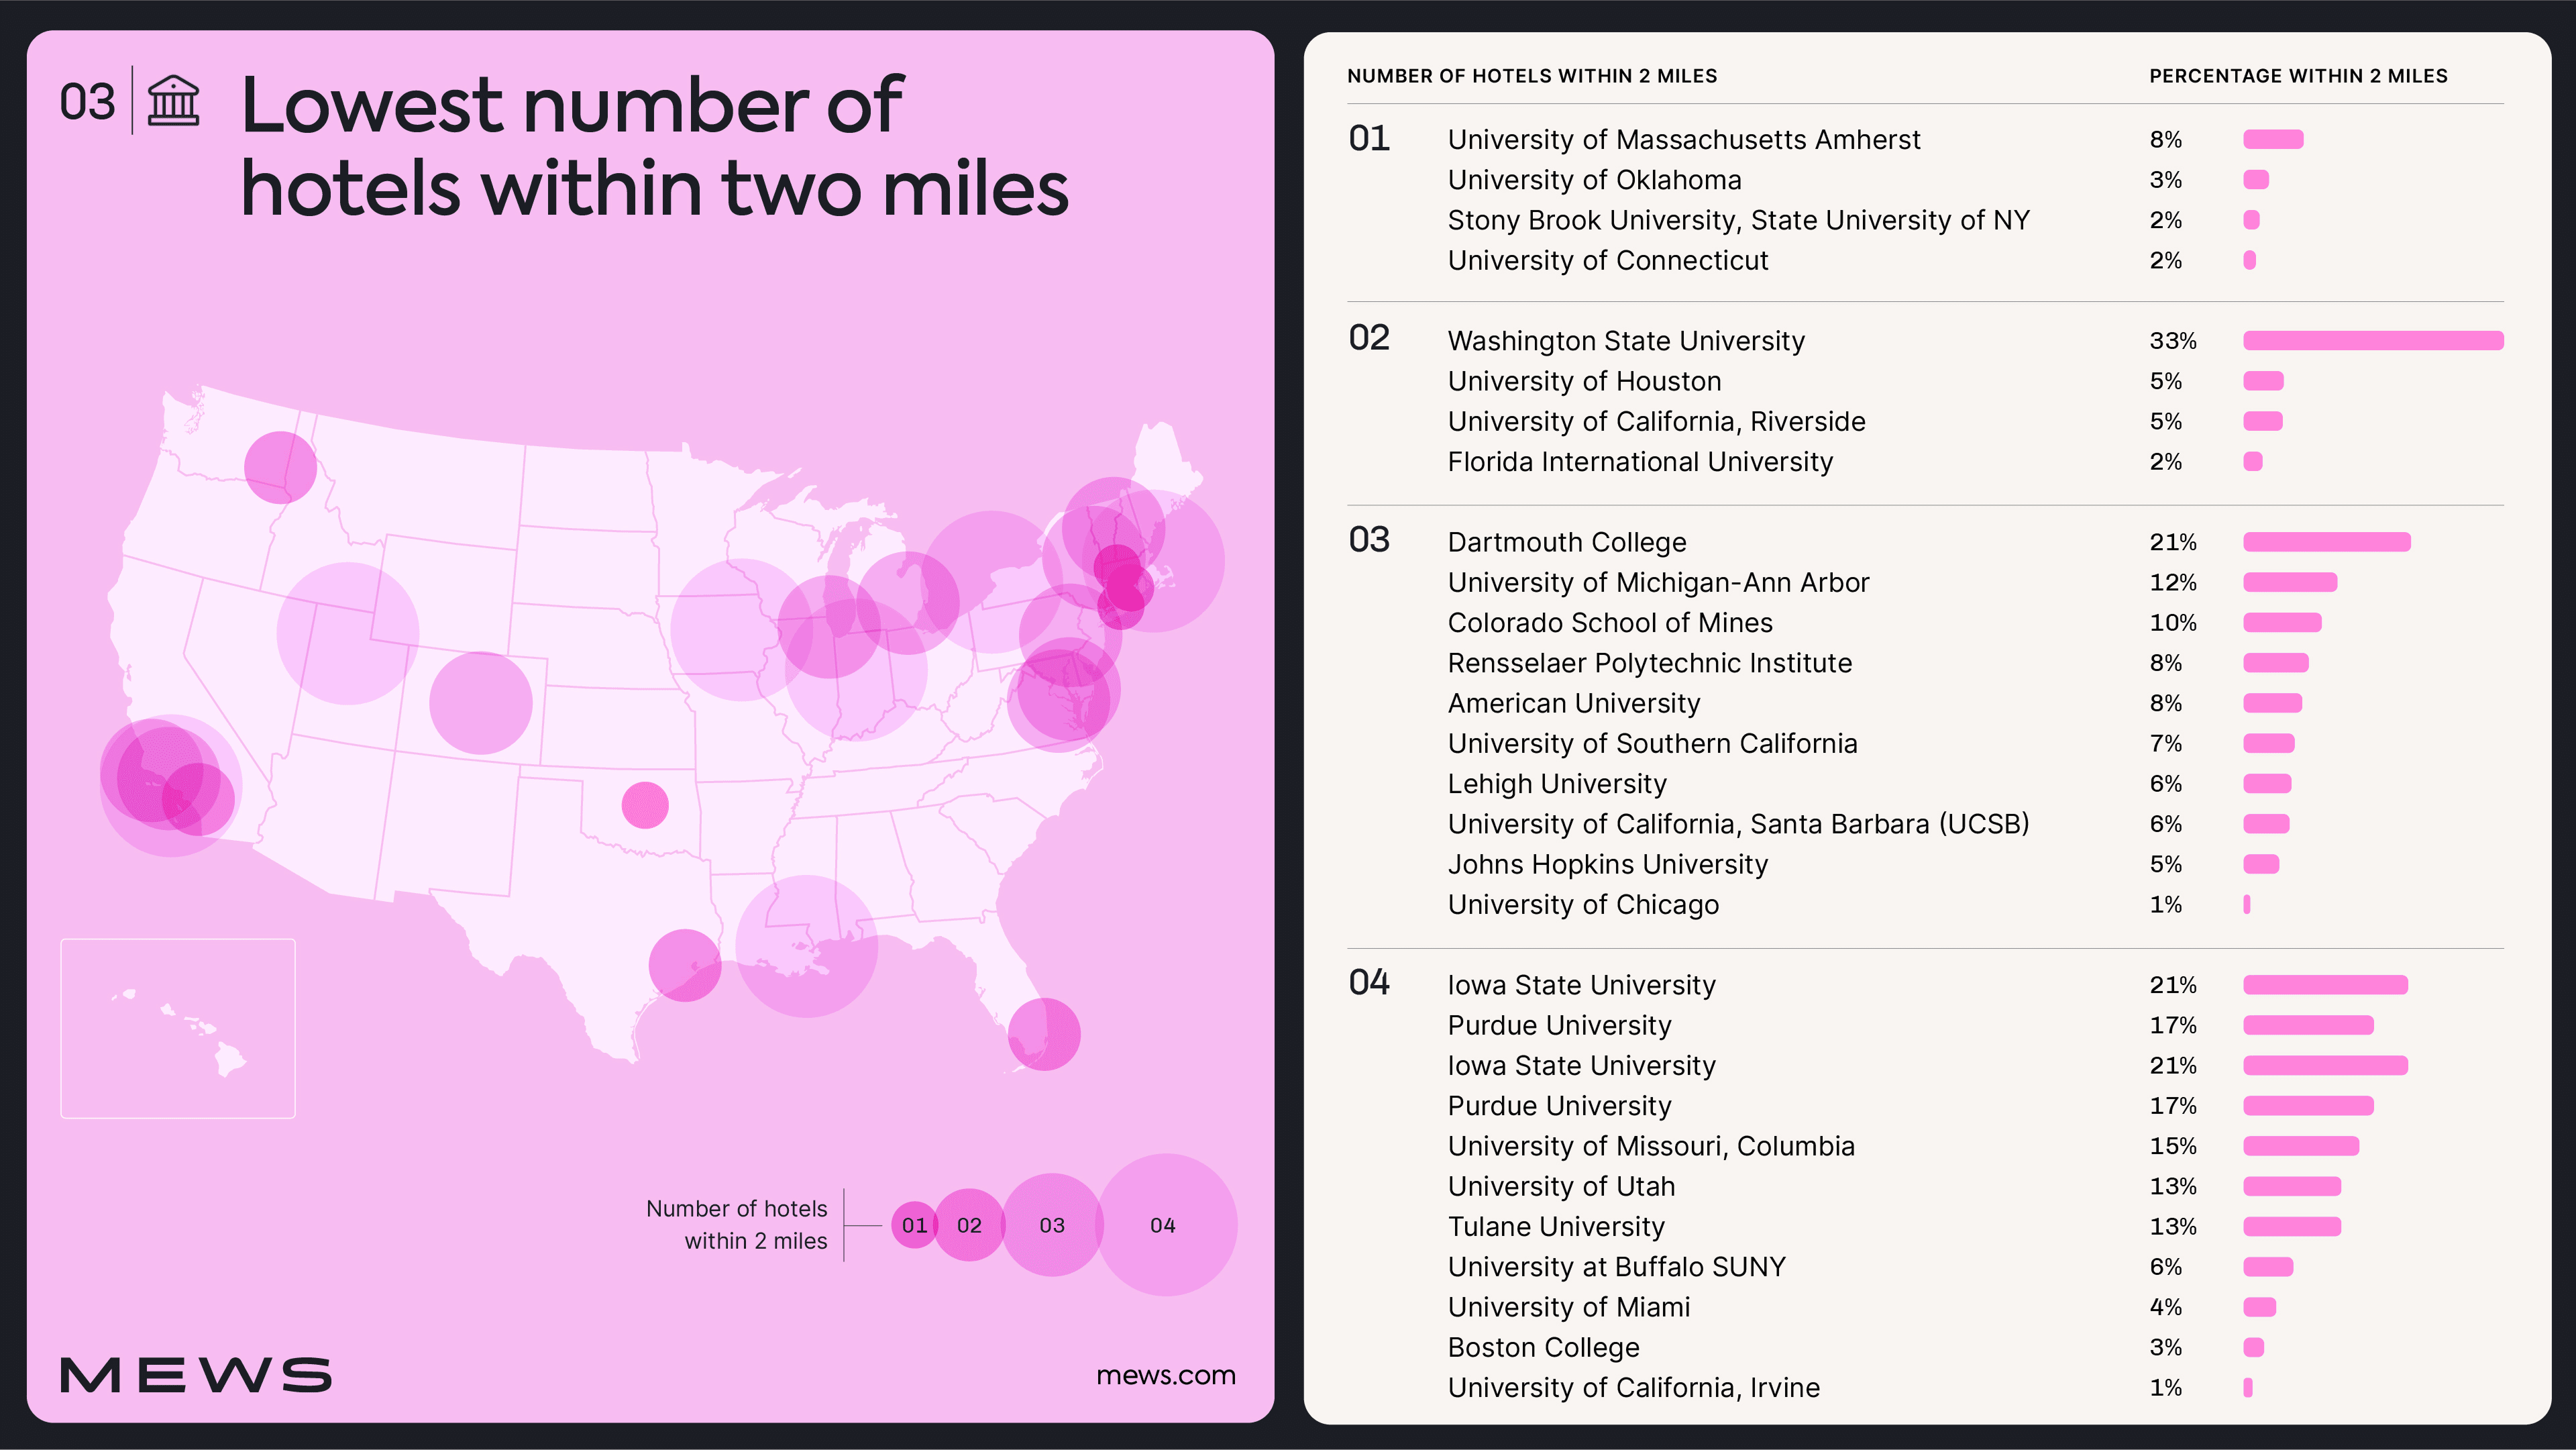
Our analysis revealed that over half (56) of the 100 colleges and universities examined have fewer than 10 well-rated hotels nearby, with 27 having fewer than five hotels within a two-mile radius of the campus landmark buildings.
Our analysis found that the University of Massachusetts Amherst, the University of Oklahoma, Stony Brook University, the State University of New York, and the University of Connecticut all had only one hotel within two miles of campus landmarks on the OTA used.
Among the colleges and universities with the fewest hotels nearby are some of the highest-rated in the US, attracting thousands of students and their friends and families to campus viewings, as well as term-time sporting and social events on campus.
The University of Chicago, ranked as the 5th best US university in the QS World University Rankings [2], has only three hotels rated three stars or higher within a two-mile radius of the landmark buildings, indicating that just 0.83% of hotels listed locally for the university are nearby.
Johns Hopkins University, in Baltimore, is rated as the 10th best nationally and 24th globally; yet, only 5% of the local hotels are within two miles of the landmark buildings. In total, just three of the 66 hotels rated three stars or more are within a two-mile radius, meaning many visitors will need to travel by car or public transport to reach the campus.
University of Michigan-Ann Arbor, ranked 45th globally and 14th nationally, also only has three hotels within proximity (two miles); however, it has just 25 listed locally, and with only 88% having parking, the fact that a mere 12% are within two miles, suggests that there could be room for existing and potential new hoteliers to help serve the thousands of visitors each year.
In these areas where guests and student visitors are more "underserved", there is clearly room for new hotels to open, as has been seen by the development and expansion of graduate hotels.
Still, there is also an opportunity for established hotels to offer services and amenities that can help to reduce the stress and rushing, or trying to visit everything in one go.
For example, providing shuttle services can benefit the local community and visitors by reducing traffic and the need to drive back and forth from the campus, and help manage parking for the hotel, especially when in/out privileges are limited.
Parking Availability To Visit Colleges And Universities
On average, nationally, 25% of total hotels analyzed were within two miles of their local college or university. However, many of these hotels are located far from public transportation systems, making parking a concern for many visitors to colleges and universities, while providing potential opportunities for hoteliers.
Our analysis found that nine out of ten (90%) of the hotels analyzed offered parking for guests, either as an included service or as an additional option, typically utilizing either on-site parking availability or partnering with a third-party provider.
Campuses Where Hotel Parking Is Most Available To Guests
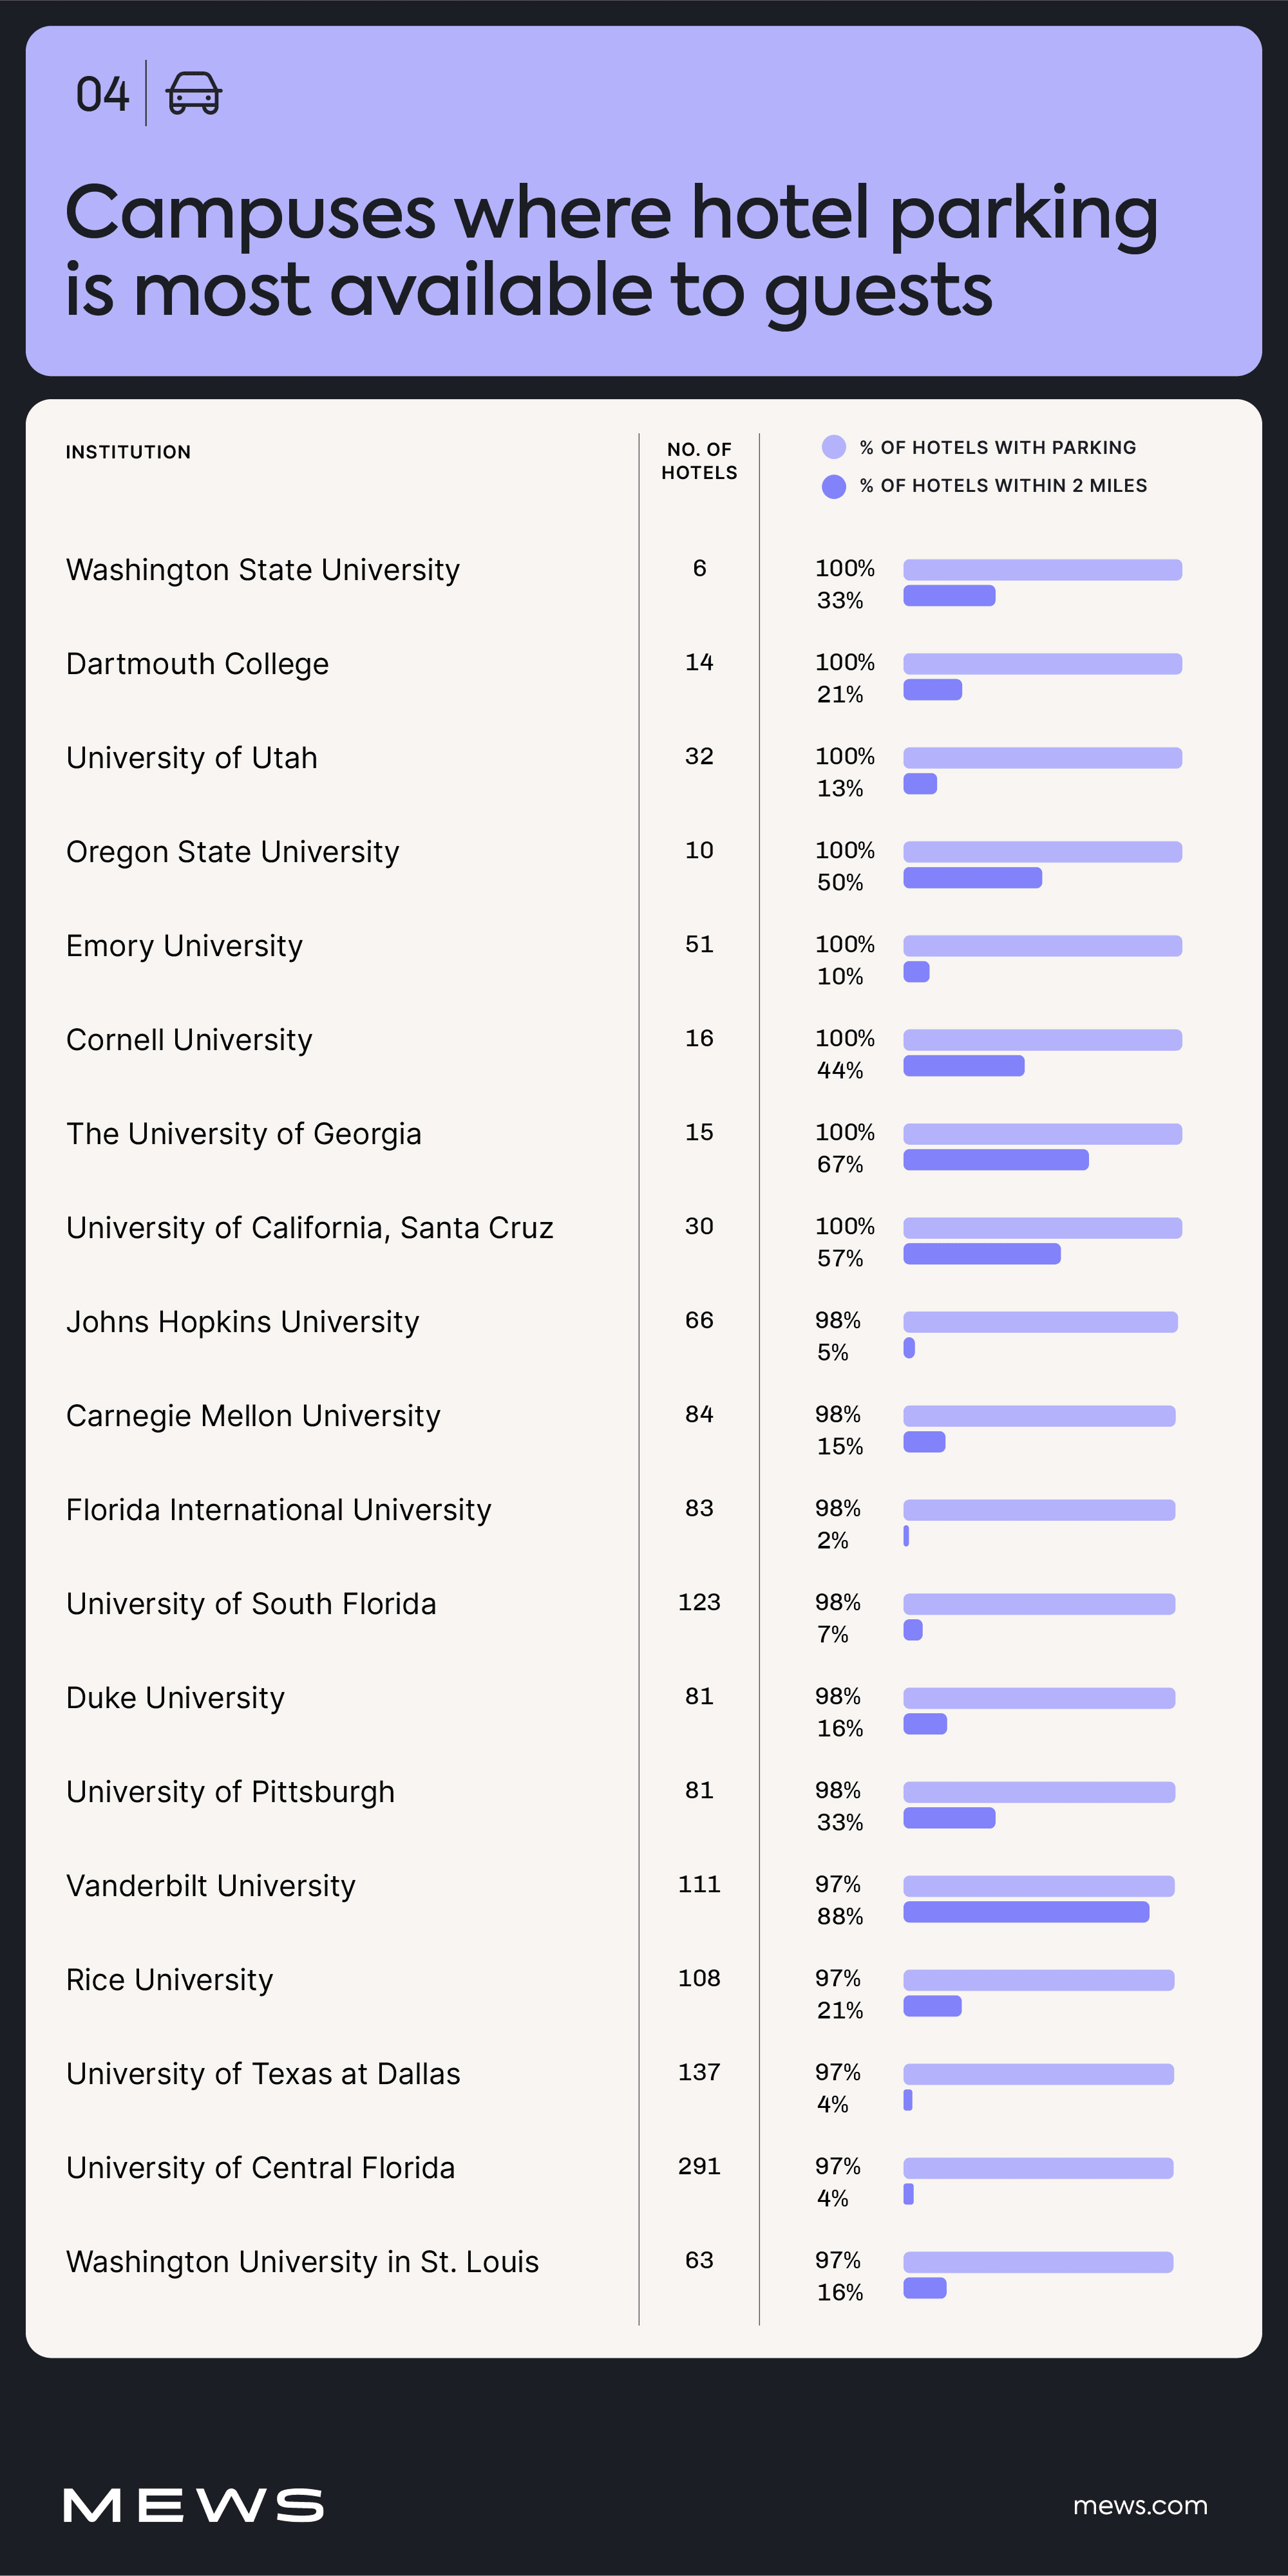
Eight of the 100 colleges analyzed in our study were found to have 100% of local hotels (rated three stars or higher) advertising that parking is available on their OTA listings.
As the table shows, where nearby (within two miles) hotels are at a premium, parking is widely available. For example, Johns Hopkins University has just 4.55% of hotel listings within two miles of the campus landmark building, but 98.48% of the 66 hotels locally offer parking for guests.
In these instances, where the distance to potential attractions and public transport is reduced, hotels and accommodation options can really benefit from providing parking services. Not only does it help broaden the net of potential guests who can and are likely to stay, but it also helps increase the streams of revenue that the property can generate.
But, as our study also found, some areas of the U.S. have a reduced availability of parking for guests.
Campuses Where Hotel Parking Is The Least Available To Guests
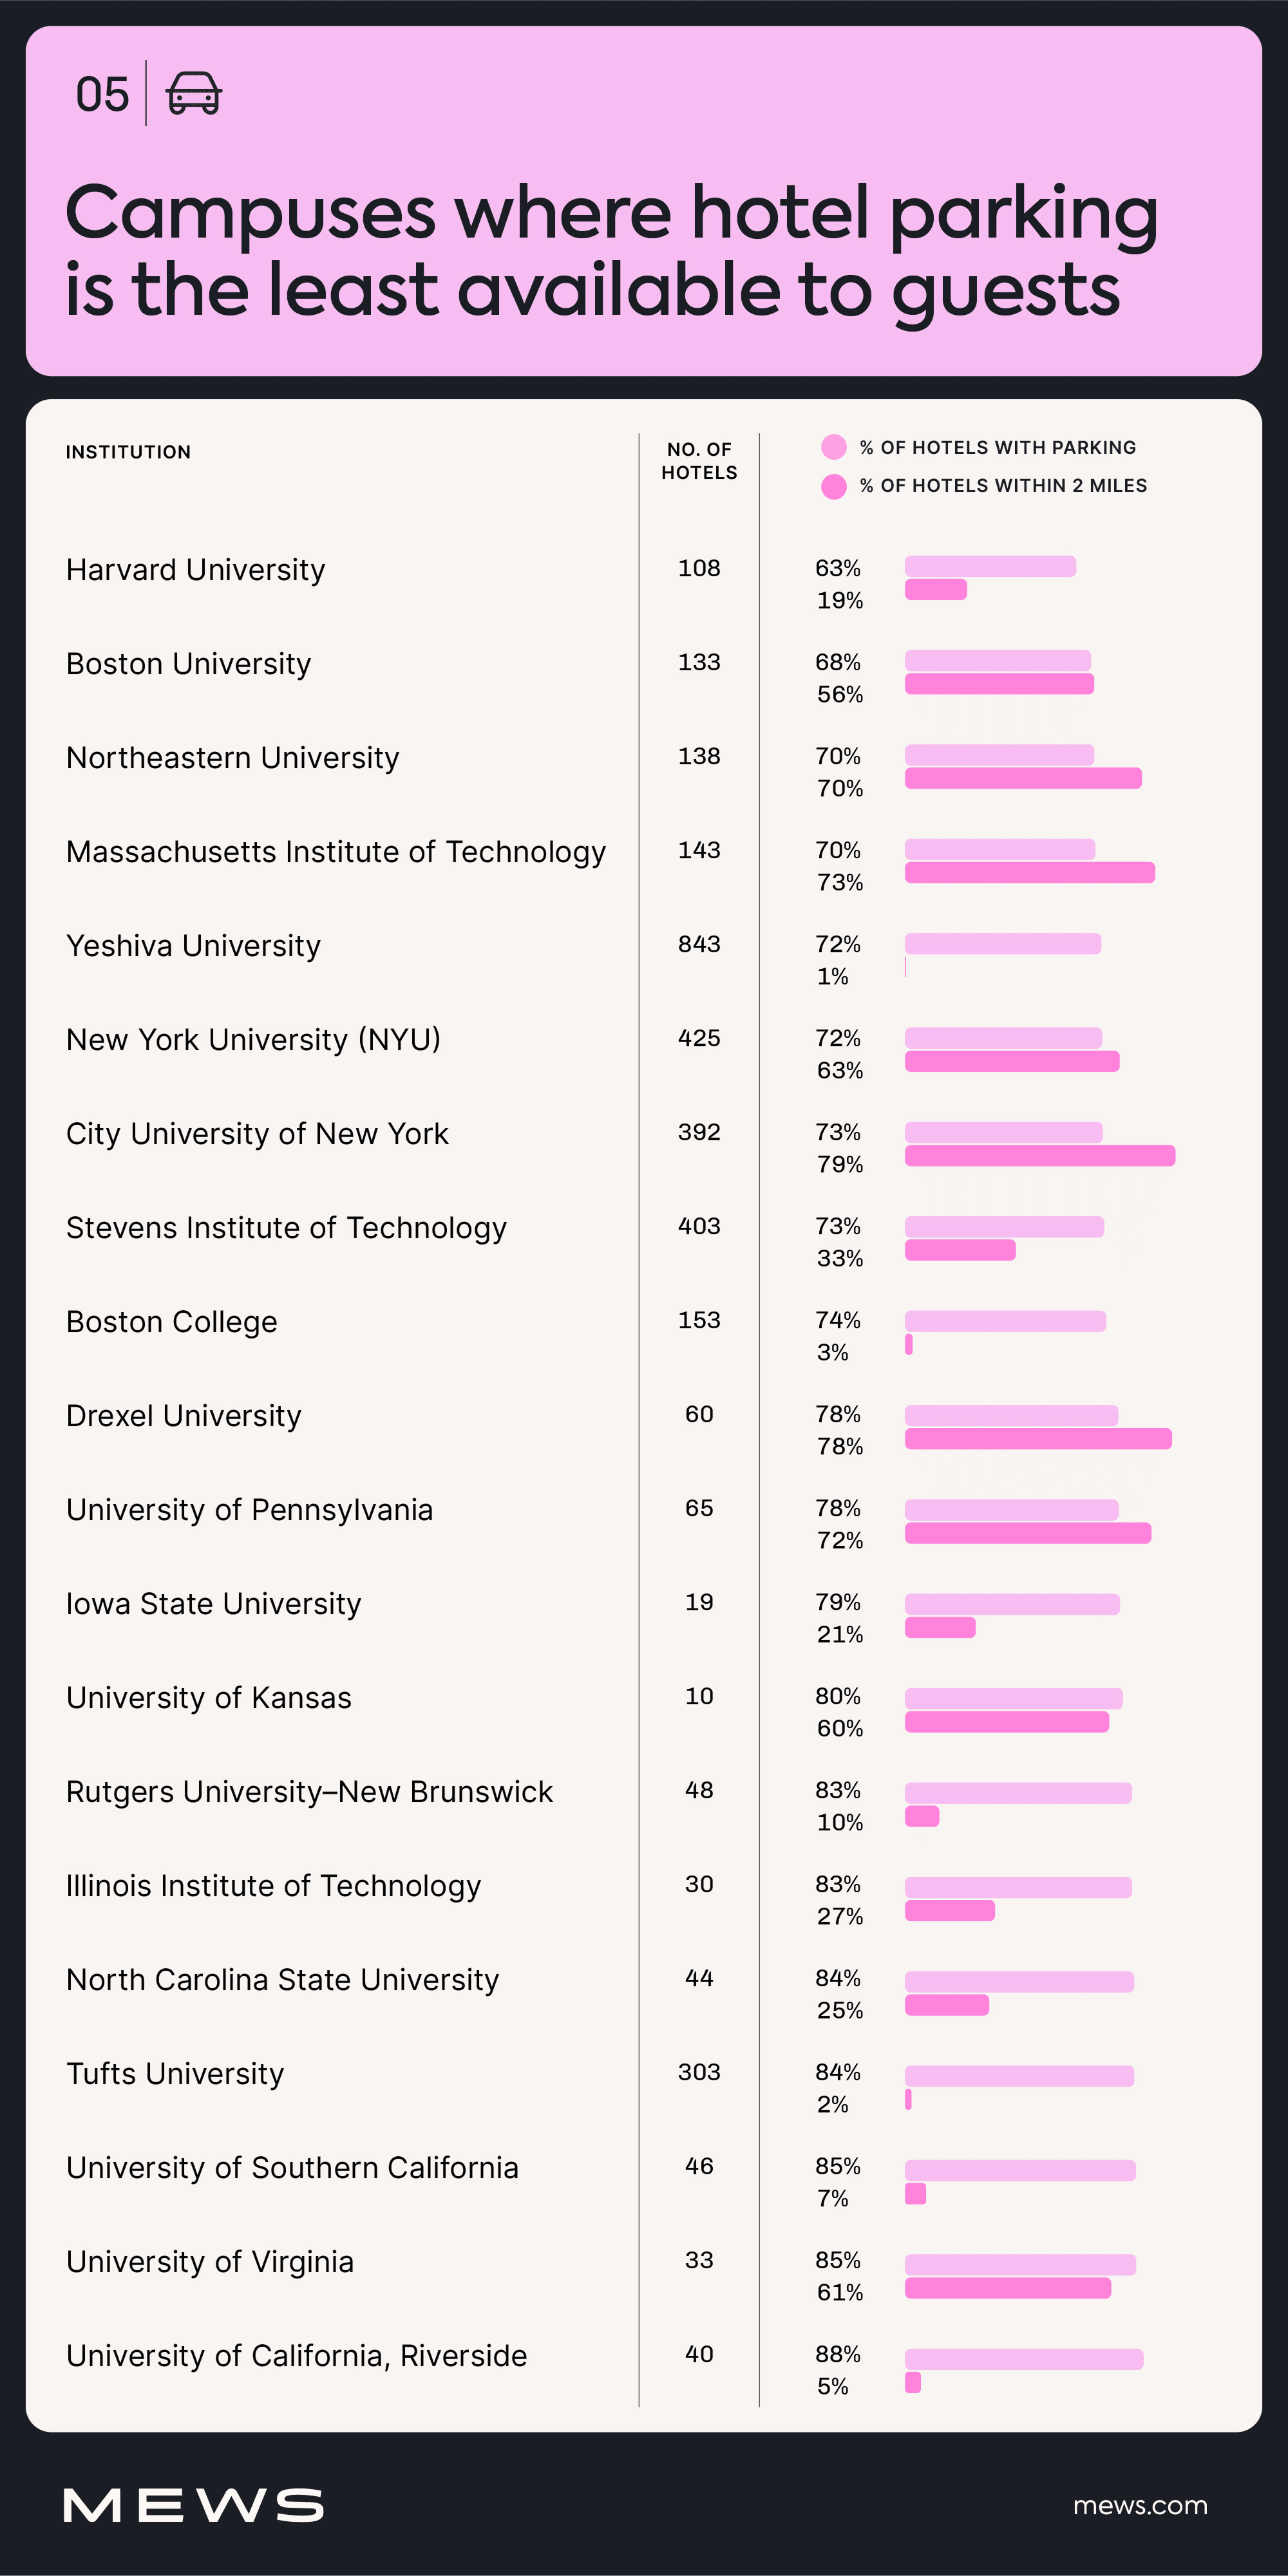
Our analysis found that the Boston and Cambridge areas have the lowest overall parking availability at local hotels.
On average, among the hotels local to Harvard University, Boston University, Northeastern University, and the Massachusetts Institute of Technology (MIT), only 67.72% of listed hotels offer parking; with Harvard University's location within Cambridge reducing their parking availability to just 62.96%.
As a result, many visitors to Boston and Cambridge universities will need to utilize public transportation and connections to facilitate their travel and campus visits. They may also consider third-party and unconnected parking options when visiting the campuses, meaning more than a third of hotels could be leaving revenue on the table by not working with local parking providers to increase the number of guests they could attract.
Outside of Boston and Cambridge, less than three-quarters (72.43%) of the hotels analyzed in New York offer parking to guests or advertise it on their OTA listings. This, much like in Boston and Cambridge, suggests that more than a quarter of New York properties could be missing out on attracting guests due to a lack of parking options.
How Can Hotels Prepare For College Visitors?
Visiting and attending campus tours peak for many colleges and universities from September to November, as prospective students seek to experience and absorb the atmosphere of active campuses.
For hotels near colleges and universities, we've shared our top tips on how to provide the best experiences for students who may become recurring guests when friends and family visit, as well as prospective workers while they study.
Track College And University Admissions And Tour Dates
Many colleges and universities upload their campus tour and visit dates in seasonal releases. By understanding when key dates and periods are taking place, hotels could amend their offerings to reflect the types and make-up of guest bookings during these dates.
This also presents an opportunity for hoteliers to implement dynamic pricing strategies, adjusting prices according to periods of high or low demand:
- Generate revenue growth at "peak" times by matching prices with demand and local availability.
- Attract long-term repeat customers through targeted lower-priced offers during less busy periods. This could take the form of "term-time" family visit periods.
Admission and tour events can also provide a secondary revenue stream for some hotels by hosting mixers or other social events in their lobbies and bars, which helps prospective students meet other applicants and potential friends before they've even set foot on campus, and potentially generate secondary revenue from food and beverage sales.
Add Services For College And University Campus Visitors
As our study has shown, many hotels are located at a considerable distance from the various campuses, meaning that many guests will either need to travel to attend their scheduled tour dates or use public transportation.
For areas with limited public transportation, this presents an opportunity to offer and advertise new features and services that help guests explore the local area and take in every part of the campus, without worrying about transportation. This could take the form of:
- Providing a shuttle service to campus locations, whether directly operated by the accommodation or through a partnership with a local third-party business.
- Extending parking hours or parking options that can benefit guests who have traveled and generate additional revenue streams.
- Reducing parking fees and vouchers to foster a stronger relationship between the accommodation and its guests.
- Collaborating with local tour companies to offer guests a broader view of the city, creating a "city break" option for those visiting a campus in the morning/afternoon and seeking additional activities to do afterwards/beforehand.
Offer Flexible Check-In And Checkout Times
Many college and university tours are structured to start in the morning and afternoon, lasting several hours each. The most common times for college and university events are 9 am or 1 pm, which means many guests may find themselves checking in or out at unusual times.
With this in mind, accommodation providers can offer adjusted check-in and check-out times, outside of the usual 3 pm or 11 am times.
- Offer early/late check-ins and check-outs as an optional extra or as a package deal for visitors during campus tour and open day dates.
- Offer guests luggage storage outside of their check-in or check-out times, as an optional extra or as a complimentary perk to help them enjoy a more relaxing stay.
- Offer luggage storage to non-resident visitors to generate extra revenue and create an opportunity to gather marketing data to promote future stays.
- Adjust car parking hours to reflect the "peak" times for guests, helping them to relax and avoid having to rush between tour times and check-in or check-out.
Highlight Local Attractions And Recommendations
When attending campus tours and open days, many guests are looking to see how the local area makes them feel and to find a home during their years of studying. For hoteliers, this presents an opportunity to collaborate with local businesses, fostering a community feel where guests can be encouraged to explore or try third-party companies.
- Participate in reciprocal referral deals to create targeted advertisements that highlight relevant amenities both within the hotel and in the broader community.
- Advertise and promote local businesses inside welcome packs or guides, helping to boost the local economy and add local insight for prospective students.
- Partner with local walking tour-type companies to offer guests an experience that showcases the city and its surroundings.
Use Targeted Marketing For Campus Visitors
Hotels can also use peak campus tours and open dates as an opportunity to target their advertising and marketing efforts, showcasing amenities that can enhance the guest experience during their visit and afterwards.
- Market bespoke packages that match campus dates and guest motivations, such as sporting events, intake dates, or even graduation and moving dates.
- Utilize referral codes around moving dates to confirm potential sales funnels, thereby helping to nurture long-term relationships and secure future referrals.
- Showcase services and amenities that will help prospective students, providing student packages or memberships to contribute to a long-term revenue stream.
- Offer reduced nightly rates for membership users to help nurture relationships and turn members into referral points for future guests.
Enhance Operations With Mobile Check-In And Digital Tools
Digital tools and mobile check-in features help provide guests with a more efficient stay, enabling guest services to manage more effectively and maintain high standards. By utilizing digital tools, hotels can prevent the potential for queues at peak check-in times, which can negatively impact guest satisfaction.
- Implement and utilize mobile check-in features or cardless entry systems, enabling guests to enter and exit quickly and avoid stressful queuing situations.
- Allow guests to purchase and order extras within the digital portals, allowing staff to manage requests efficiently and effectively.
- Provide regular information to guests that enhances their stay, from traffic notifications to detailed service availability and upgrades that would be of interest.
- Utilize a one-stop portal that helps staff to manage and deliver for their guests, preventing requests from getting misplaced or missed revenue opportunities.
Full Rankings
Methodology:
Our analysis identified hotels associated with and located near each college, using Booking.com's systems as a reference. For each search, we pulled the total number of accommodations available. We filtered them by hotel star ratings (three stars and above), distance from the landmark (half mile, one mile, two miles), and availability of parking.
In some instances, where Booking.com's system was limited, we had to use defined buildings or secondary landmarks within or close to the campus grounds.
Our analysis reviewed the percentage of accommodations that are hotels with a three-star rating or higher, the rate of hotels within a two-mile radius of the college, and the percentage of hotels that advertise parking as available.
Our rankings reveal the colleges and universities with the most and least availability of hotels nearby, indicating areas where visitors may need to book well in advance, and where hotels are currently in short supply.
Sources:
[1] First-year Application Trends, Common App
[2] QS World University Rankings 2026: Top global universities, TopUniversities