Real-time hotel analytics with AI Insights.
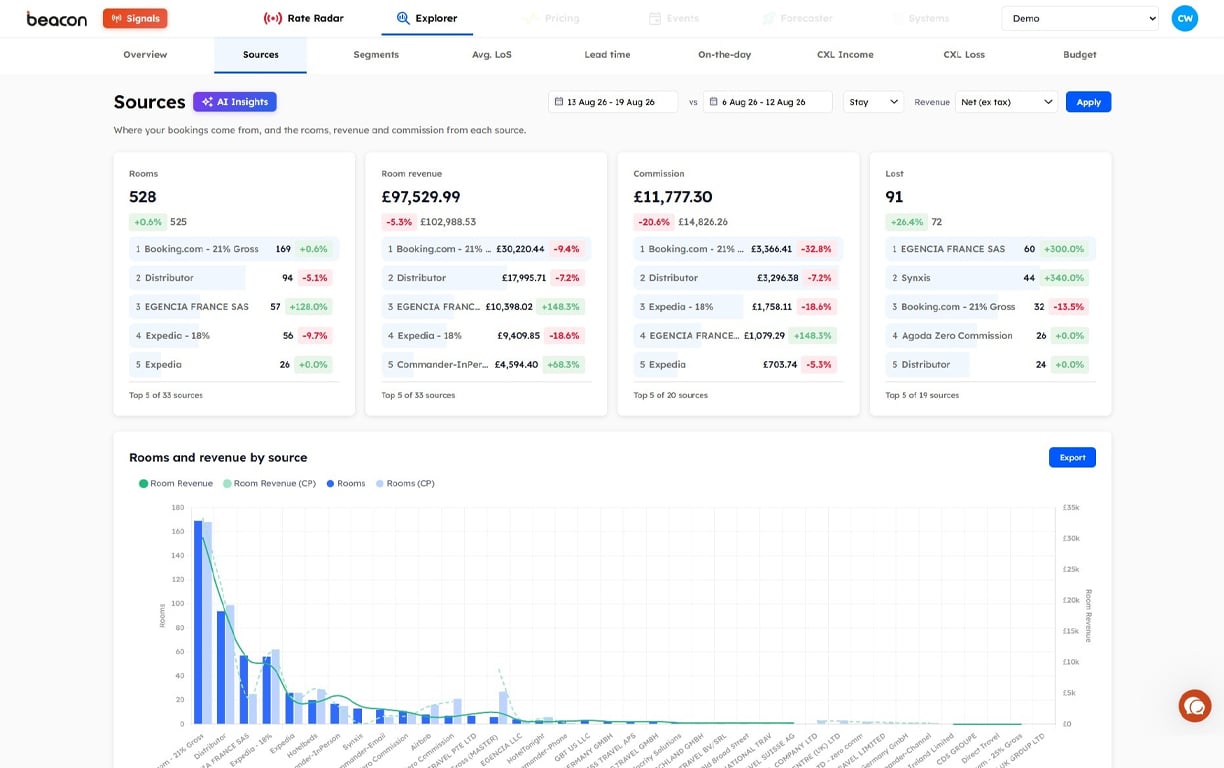
See your revenue three ways: Gross — what the guest paid. Net (ex tax) — the figure your PMS records. Net (ex tax & commission) — what you actually kept.
Switch between them on any report with one click and track your property's true revenue performance, or benchmark booking sources to identify the most profitable. Visibility boosters can be tracked too, so your revenue figures stay accurate when an OTA's commission changes.
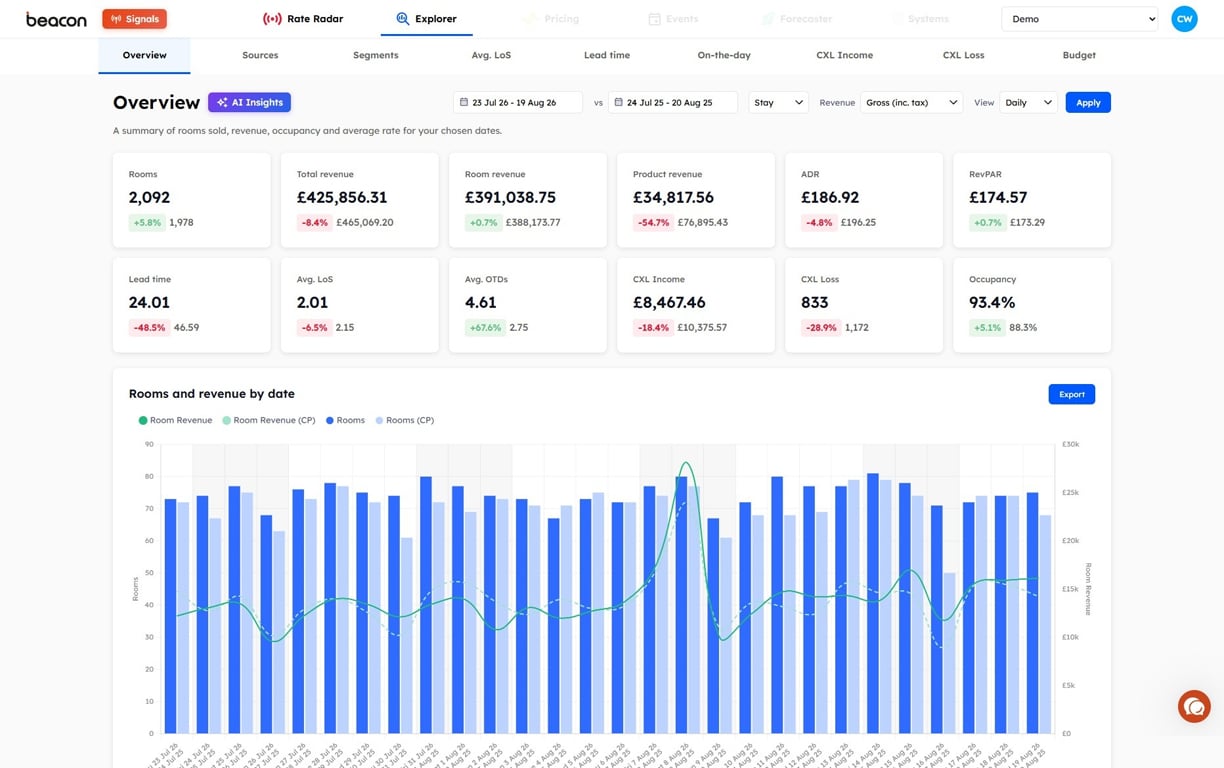
Explorer updates the moment a booking is made, changed or cancelled. Revenue, ADR, RevPAR, occupancy, sources and segments — live and in one place.
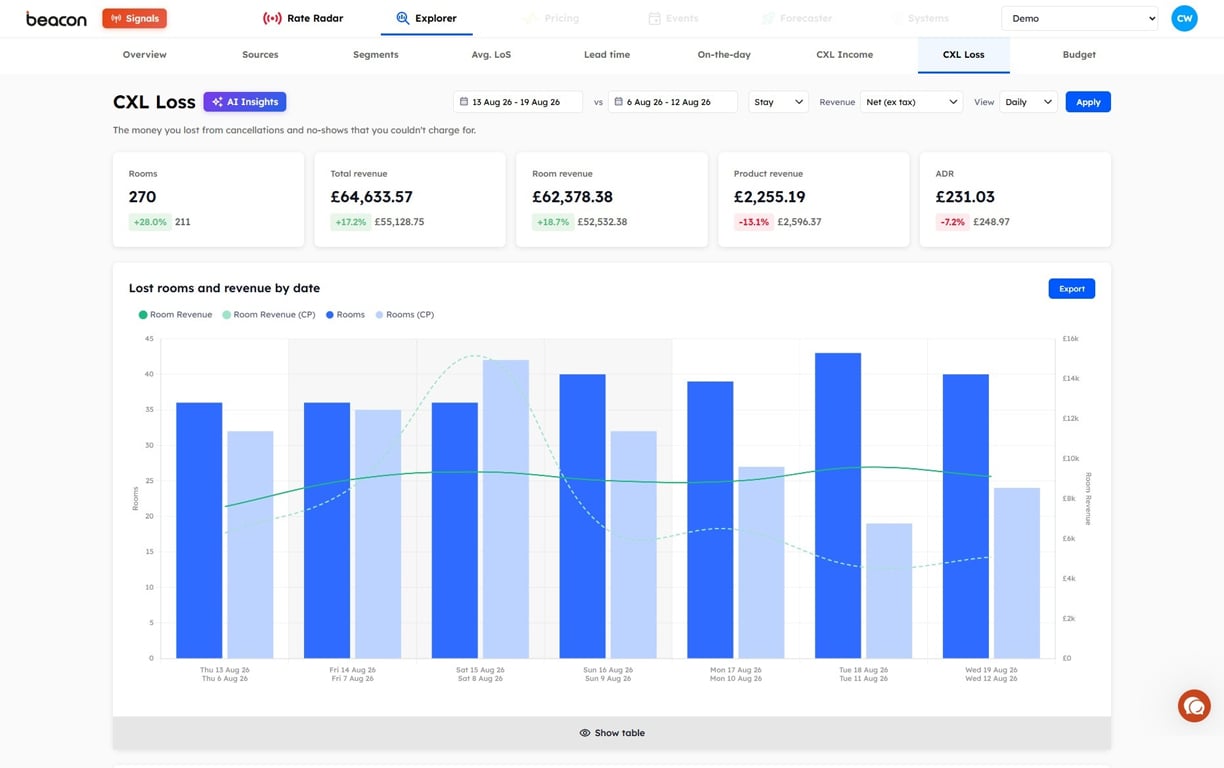
Cancellations are reported two ways: revenue lost and kept. You see the true cost of cancellations by source, segment and room type, and the patterns behind them.
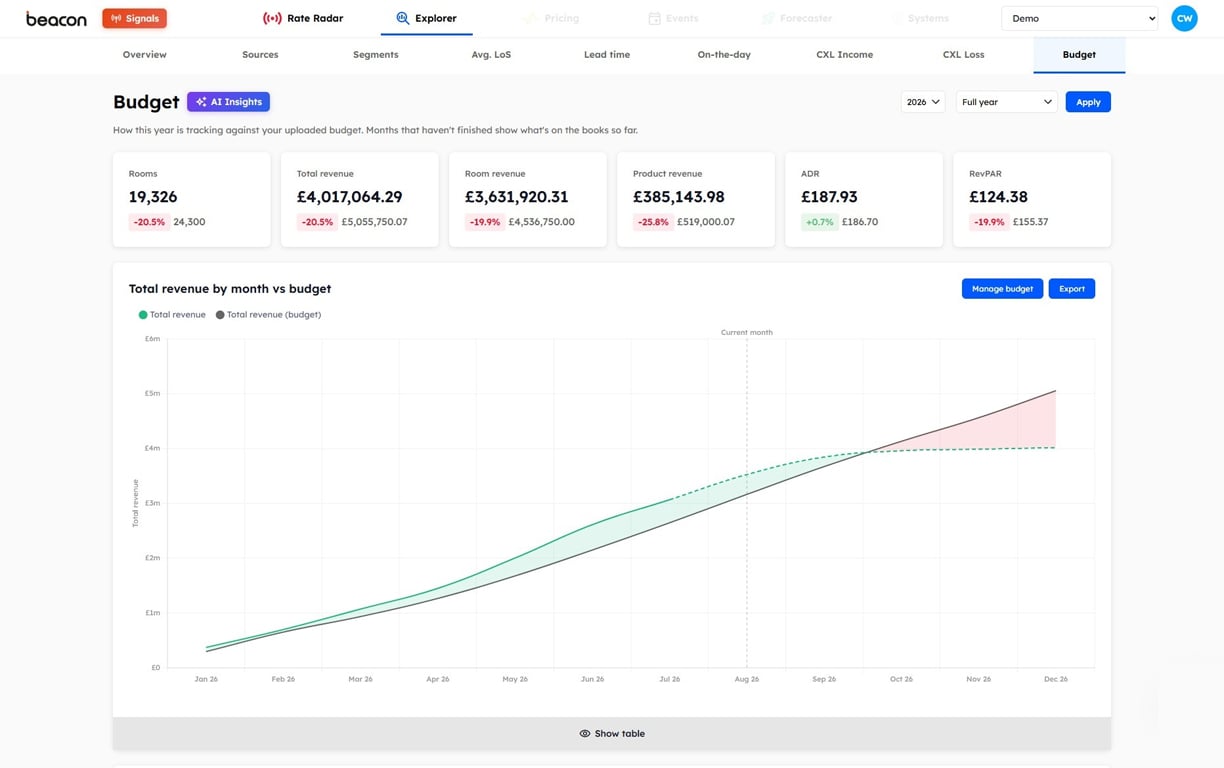
Upload your budget and Explorer keeps track, month by month. You know what’s ahead, what’s behind, and where to push before the month closes. Messy PMS segments can be grouped into the lines you actually budget on.
Compare any period against any other with a click. This month against last year, this week against last, stay date or booking date, gross or net. Comparisons line up by day of the week, so Mondays compare to Mondays.
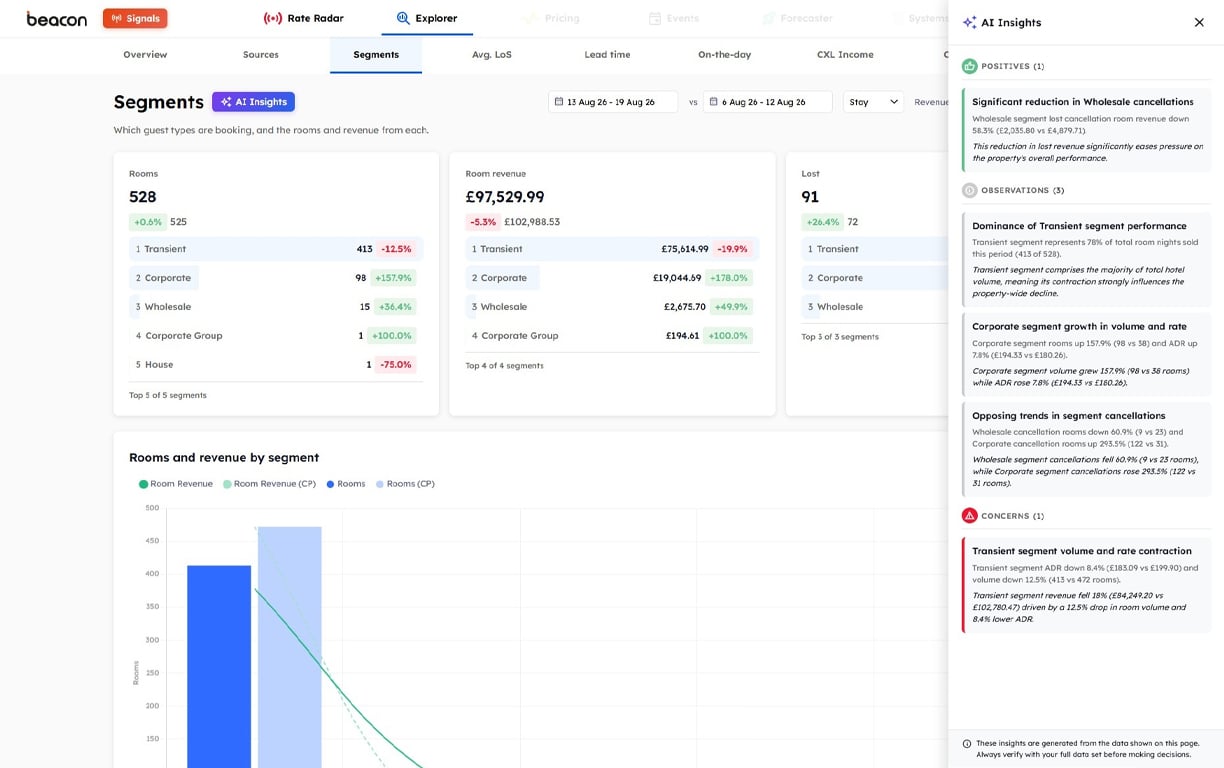
Every page has an AI Insights panel. It reads the data you’re looking at and tells you what’s going well, what’s worth watching and what needs attention, with the numbers behind each point.
Explorer is built for hoteliers, not data analysts. Every report is clear enough for front-of-house and detailed enough for the general manager, so the whole team works from the same numbers.
Product Gallery