


In a nutshell, Power BI (business intelligence) is the journey from data to decision. We all generate a lot of data, which in turn brings opportunities (insightful decisions, timely action and focused efforts) as well as challenges (time to implement, learning curve, cost). By taking the right learnings from BI, hotels have the possibility of transforming their hotel’s analytics to make important data-driven decisions.
So what is Microsoft Power BI, what is it used for, why is it beneficial for hotels and how does it work? We’ll look at all of this, as well as how it can be integrated with the Mews API in the hospitality industry.
What is Microsoft Power BI?
Microsoft Power BI is a business intelligence platform that is ideal for all members of your hotel staff to be able to use, no matter their level of technical skills. It helps to aggregate, analyze and visualize data while at the same time allowing you to easily share data. For hotels that already run on Microsoft products, it is an easy self-service tool requiring little training, and easily integrating into a modern hotelier’s toolkit.
What is Power BI used for?
Power BI can generate data visualizations, help understand hypothetical situations, so you can make better decisions, and can create real time reports that help with forecasting. Using these functionalities, you can create executive dashboards, allowing department heads to easily get insight into the health of each department. Read more about 7 changes that can make improvements across departments.
It can be used to create all kinds of reports, which together with your PMS’s data can give you powerful insights into your hotel’s key performance metrics, and make data accessible across departments.
Why is Power BI beneficial for hotels?
Today’s hoteliers are operating in an increasingly competitive environment, in which they should take full advantage of the wealth of data at their fingertips. With Microsoft Power BI it’s possible to filter through and then transform such data into clear stories which help to better understand a hotel’s performance, cut costs, enhance the stay experience and build long-lasting relationships with guests.
Every hotel has a specific set of needs, and as properties grow the number of data touchpoints increases (websites, restaurant POS, conferences and events, PMS and reservations…). What’s practical is that Power BI allows us to have multiple data sources and the app allows data to be easily manipulated whilst on the move, helping to provide instant answers to questions.
Below we mention some of the most useful benefits of this tool.
Accessing data from different sources
Hotels use data from multiple sources, and you need a tool that is able to view, analyze and visualize data easily in different formats. Whether you are getting information from your property management system or from Google Analytics, hoteliers are dealing with a lot of different data sources, which this tool will help you better manage.
Integrations
We’ll get to integrations with the Mews Property Management System later, which is a huge benefit, but it also easily allows you to sync up with Excel business data so that you can analyze, publish and share the data with stakeholders throughout your hotel leadership team and managers.
Use insights to take concrete actions
Thanks to Power Business Intelligence, you can use the data and insights to make decisions about all kinds of data points and Key Performance Metrics, whether it be length of stay, average daily spend, commercial reports, performance across departments, or revenue reports, among other crucial data. Using this tool can do wonders for better understanding KPIs that can drive revenue and profitability.
Detect valuable trends
Thanks to the tools' machine learning function, you can detect valuable trends and better forecast so that you can better predict booking trends, peaks in demand and changes that go against normal seasonality.
How does Power BI work?
Power BI uses machine learning and predictive analysis to take what can be created in Excel to the next level. It provides valuable insights based on real time data, as well as interactive dashboards and informative reports which can empower industries to differentiate themselves and make data-driven decisions.
Learn more about how data drives faster and more impactful decisions.
How can Power BI be integrated with the Mews API in the hospitality industry?
We’ve been using the Mews API and Power BIto generate a set of intuitive reports which we believe today’s hoteliers need in order to analyze what’s really important to them. We’ve used our API to make imports and exports from Excel a thing of the past, removing the need for manual manipulation and eradicating human errors. Here’s what you can do with Power BI:
- A revenue report... which can be split by market segment.
- A commercial workspace... designed for sales teams who need to own their data and their performance, to gauge how well or badly their hotel is performing.
- Real-time data... which is accessible to everyone in the property.
- A length of stay report... with different filters which allow users to drill down into historical data
- A returning customer report... which looks at spends, market segment, seasonality and choice of room type.
- An accounts aging report... which shows how long it takes for invoices to be paid per zone / property / cluster / customer.
- An F&B turnover dashboard... which allows a hotel to measure the performance of individual F&B services.
We’ve created lots of management report templates, whose functionalities include:
- The possibility to access data straight from the Mews PMS
- A performance-type dashboard which offers an instant visual overview of the hotel’s activity and YoY analysis
- a high level of granularity (e.g. visualizing the split of OTA revenue by month and by guest gender)
- aggregating Google Analytics against PMS data
- creating different types of management reports
Three of the most popular reports are:
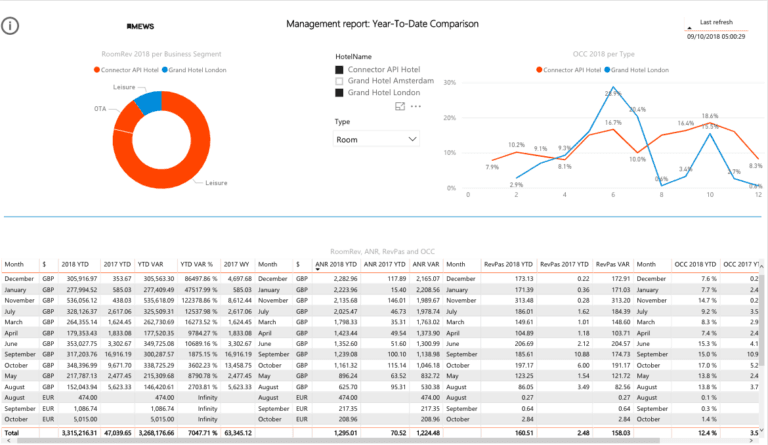
The YTD Comparison
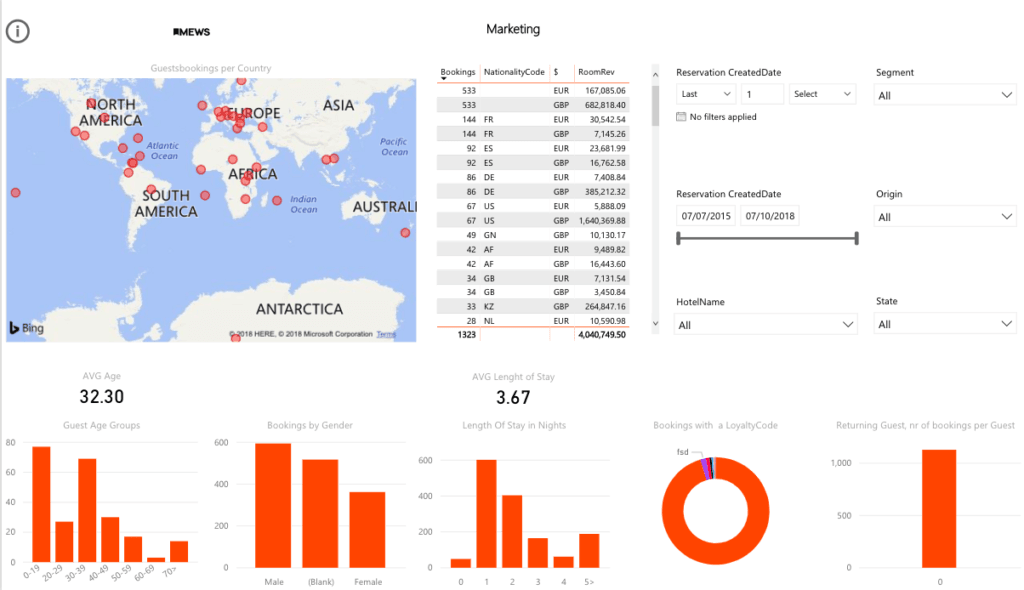
The Marketing Report
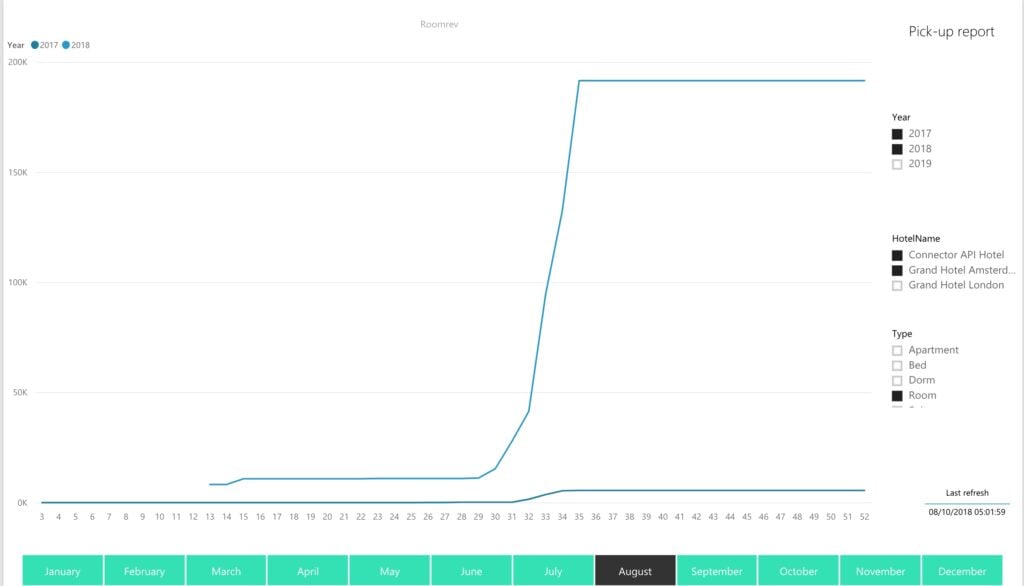
The Pick-Up Report
Our clients can access all of these for free on our Enterprise subscription and our hope is that, in time, they will become a default set of reports.
Conclusion
We’ve looked at Power BI and its ability to visualize, analyze and aggregate important data from different sources. The beauty of relying on data from a variety of sources is that you can make more accurate decisions that address a hotel’s needs from a holistic point of view rather than on segregated instances. The better you can visualize this data, the easier it will be for leadership to make data-driven decisions that will positively affect the hotel’s revenue, performance and profitability. This is where a powerful tool can create powerful results.
Written by

Eva Lacalle
Eva has over a decade of international experience in marketing, communication, events and digital marketing. When she's not at work, she's probably surfing, dancing, or exploring the world.