


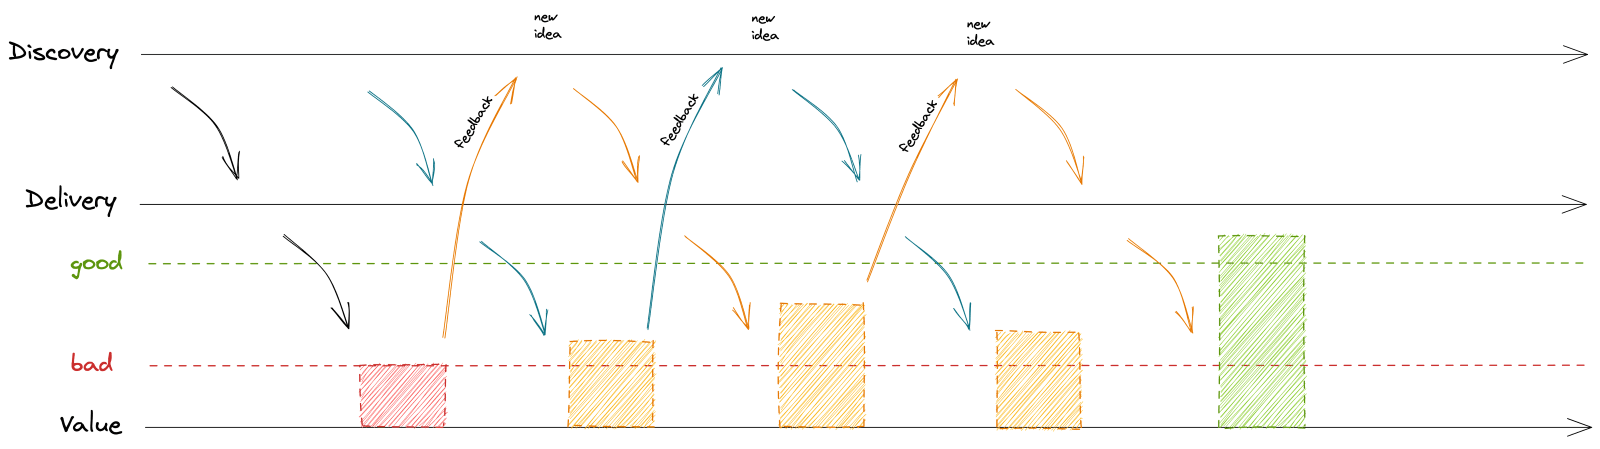
The world of software creation has been talking about continuous delivery for quite a while. Most of you are probably familiar with the picture below, which is evangelized by the Silicon Valley Product Group (SVPG).
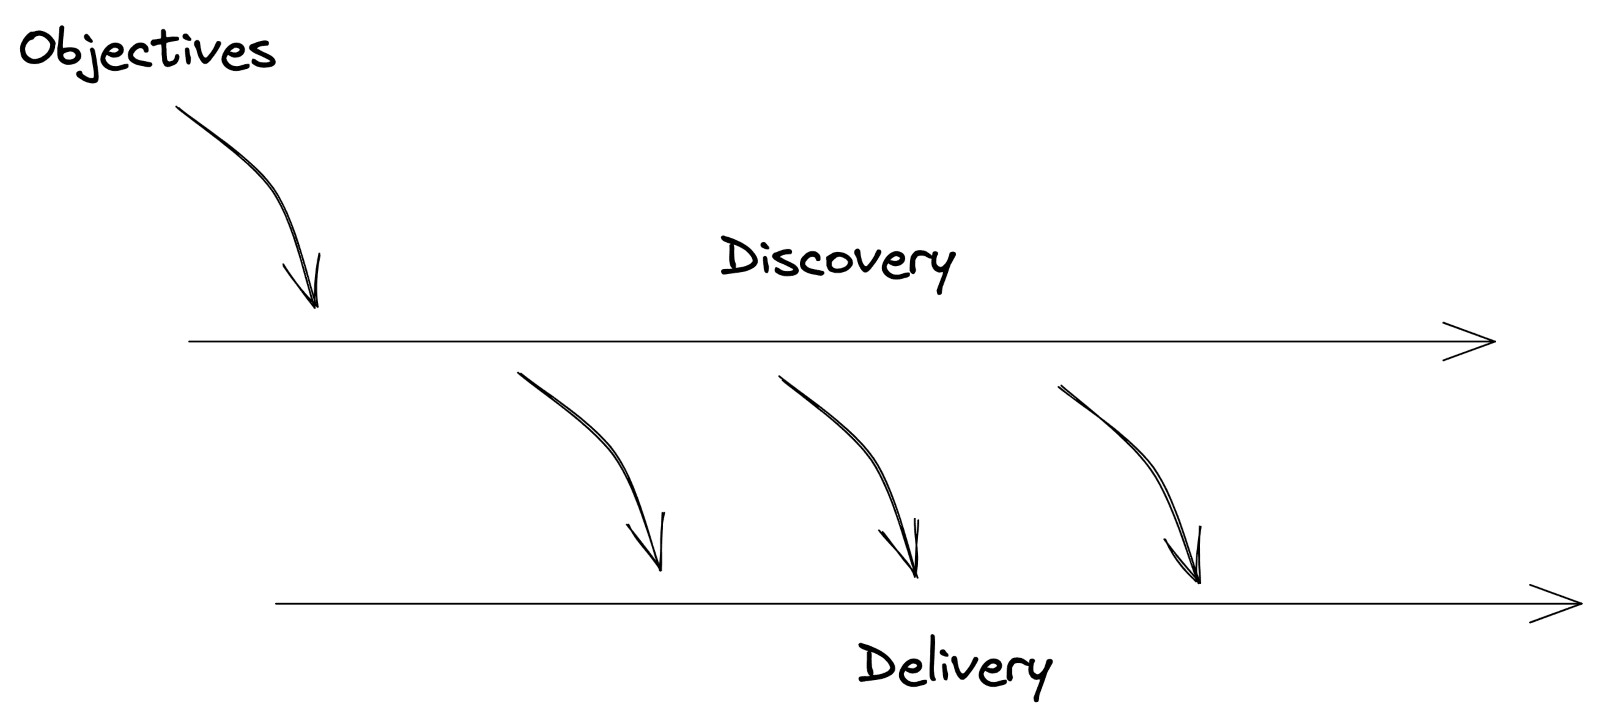
If you’re not familiar with it, continuous delivery, as name implies and the image shows, is a approach where you automatically deploy incremental changes into the production environment for easy trouble shooting and fixes. It’s effective and useful, but I don’t think I’m alone when I say that it can be hard to figure out how to put SVPG’s teachings into practice.
After some time, though, of working through it, I’m now seeing the benefits firsthand and want to share some of those learnings to help you and your teams shorten your learning curve. In this blog, I’ll try to bring you closer to applying these teachings yourself, first, by sharing a small specific example, and second, by reverse engineering the above picture.
Why is continuous value delivery important?
Let’s start with the why. Why do we want to work in this way? Sure, we want to hit our objectives to get closer to our vision. But we want to make sure that we solve the problems of our customers while doing so. And if we can succeed there, our product becomes “sticky.”
But what does this have to do with continuous delivery?
For one, by iterating and updating quickly and pushing out small changes quickly, your customers won’t have to wait for some big release with multiple updates. At the same time, if there is any issue to troubleshoot, there’s no question where to look and fixes are fast. This means you’re meeting the needs of your customers promptly and regularly, increasing the value of your product for your customers.
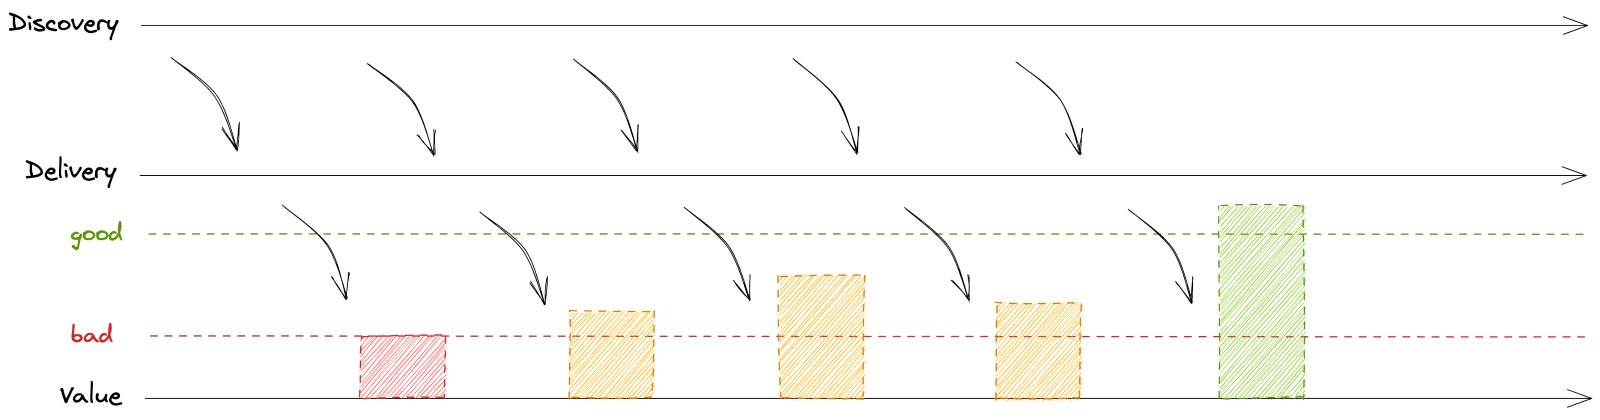
Adding customer value to the SVPG model
Let’s now look at the above picture a bit differently; read it bottom up and add one more level: customer value. Customer value doesn’t happen with delivery itself – it’s a step behind. You need to drive activation and adoption of the deliverables so that they can trigger a positive delta in customer value.
Remember, your product exists to solve a problem. That problem should be reflected in product usage data. At Mews, we use Heap.io to monitor product usage and build reporting easily on top of that. When we think there’s a problem, for example because customers pointed us in that general direction during user research, we need to uncover the problem in the data. We’ll find a metric – or a set of metrics – that can paint a picture of what bad looks like and then use that as a signal that the problem really exists.
When we add customer value to the model, suddenly you can see the net effect of the iterative updates.
Delivering better customer value: a real-world example
During our customer interviews in the US, we heard that while our reporting is very flexible, it can also be complex at times. I looked into Heap and built the following report in less than five minutes.
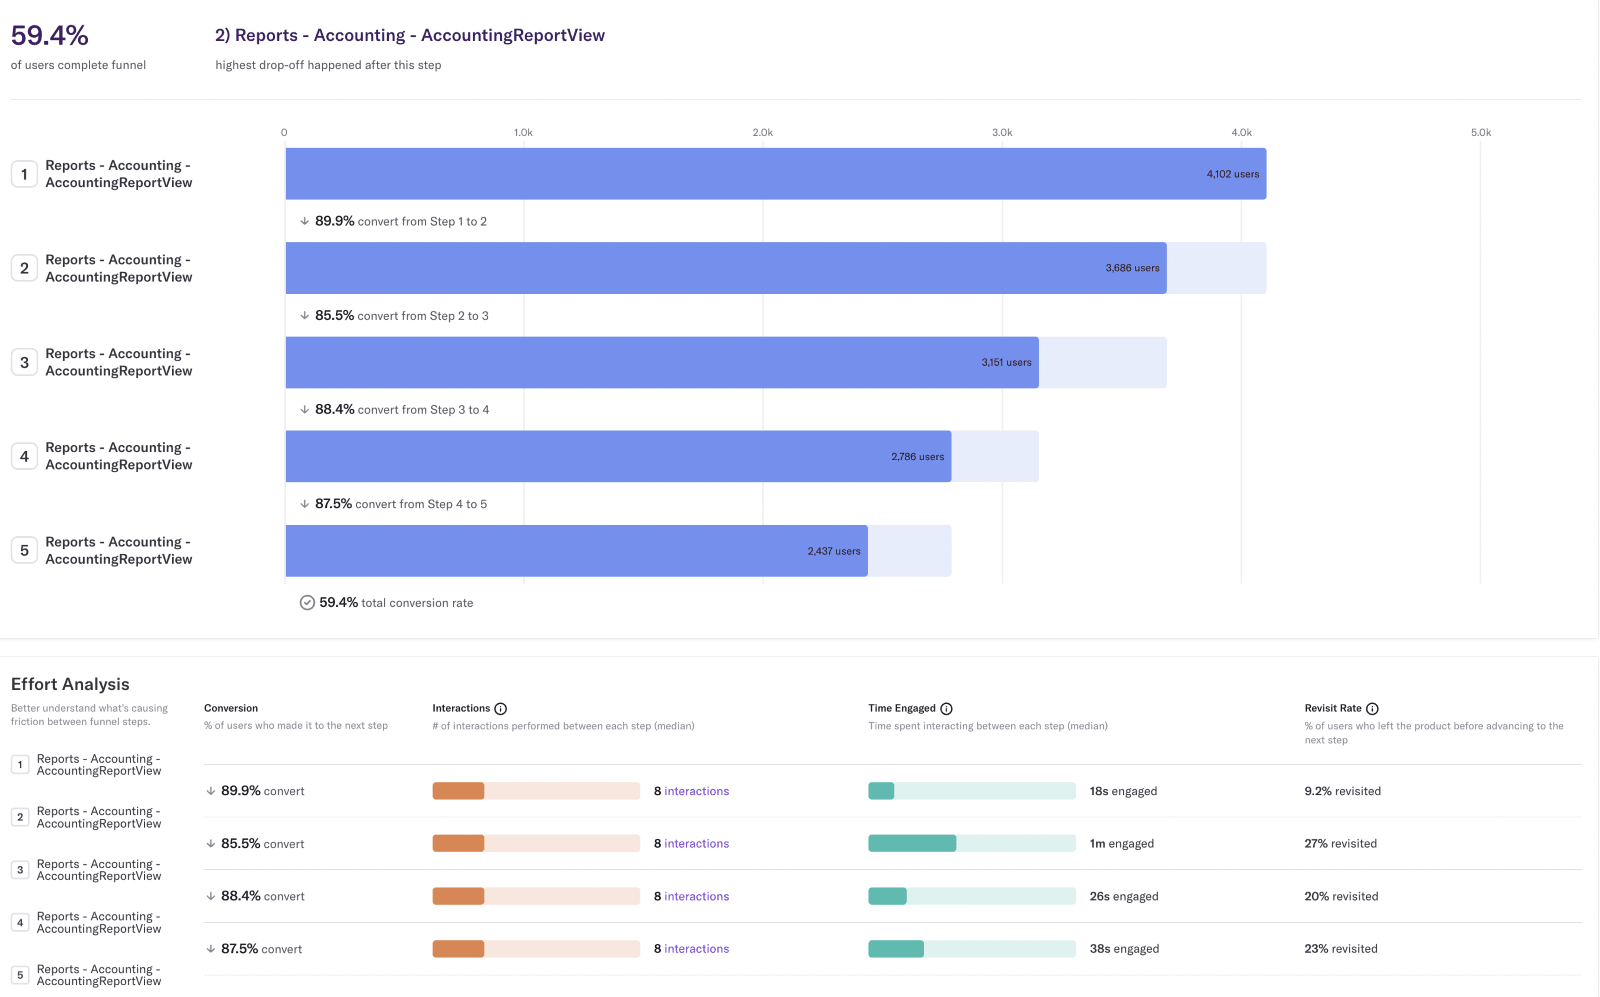
The report above is a funnel of how many people visit the same page (the Accounting Report) up to five times. It tells us a few things:
- 59% of users display the accounting report at least five times in a row, which may indicate that they keep coming back to fine tune the parameters.
- 90% run the report twice, telling us the defaults are likely not the most useful defaults.
- It takes 8 clicks to reconfigure the parameters.
- More than 85% of interactions end up with the user running the report again, but using different parameters.
That report serves as our data baseline. We clearly see evidence that customers have to adjust the parameters to get the information they need. Of course, it's always possible that I could be misinterpreting the data. There might be better data available. But this is enough to start with as a sign that there’s room for improvement and to get us closer to “good.”
So then we have to ask, "What would good look like?" Ideally, we would see 80% of users find what they need in the accounting report on the first load. No clicking, no changing the parameters. It’s an ambitious goal, but, as with any other goal, what’s more important than the number itself is the direction that the goal suggests. Ultimately we want 0% of users to load the report five times in a row – or, really, no more than two or three times.
Last, but not least, we'd like them to invest much less effort into loading the report another time, so we should aim to lower the number of clicks between page loads from ten to five.
Note that the definition of good does not prescribe the solution. It just speaks for when we think the problem is solved. It might not be the best solution, but the first goal is for it to be good enough. As we work towards it, we might figure out there’s a better description of what bad looks like and therefore also a better definition of good. Fail fast, learn fast. And, this is where continuous delivery comes into play.
How to succeed with continuous delivery
The key to success with continuous delivery is to focus on value, not features. If you start by thinking about customer value, it’s much easier to stay away from thinking about features, especially the big bang releases we often think about and plan for. You suddenly have to think about a multitude of aspects that can help you move from bad to good – quickly. One reason is that development is expensive, and you want to solve problems in the cheapest way possible. But the main reason is that you want to deliver value to your customers as fast as possible.
The longer you work without a release, the bigger the risk that you have wasted development time, the bigger the risk that you are building the wrong thing, but mainly, the longer you keep the customer struggling with the problem. Every movement away from bad to good counts. The sooner, the better. To continuously increase customer value, you need to continuously deliver.
But what to deliver? That’s why you need to continuously discovery too. You need to continuously review how the problem evolves with each delivery. Take feedback. Learn fast, fail fast. Learn how you move between bad and good, experiment and advise what to deliver. That’s depicted by the blue dotted line below.
It’s human nature to try to solve the problem in one go, which most often means using a waterfall delivery where you’re entirely focused on one solution that you think will solve the problem (fingers crossed). If you’re lucky, you deliver some incremental value and don‘t discover much later that you’ve inadvertently worsened the issue. Taking a waterfall approach also means you’re not doing many experiments, meaning you’re not innovating.
The easiest way to start is with a low hanging fruit – following the above reporting example – trying to change default parameters, renaming labels, etc. This is an easy way to move towards good. And in the meantime, we can experiment with other parameters. For instance, plant a fake ‘door’ of a named parameter setup to see if people would use it and if it would move us towards good.
Don’t forget the bigger picture
Obviously, we need to focus our efforts based on our OKRs. What is it we want to achieve this year? All of the above presumes we do these things because they support our company OKRs – in this case, it would be a goal around making our platform effortless to interact with.
We moved bottom up, from continuous value to continuous discovery. The last remaining thing is to stop ‘planning’. That doesn’t mean we’ll start doing random stuff or stop planning. Continuous discovery is continuous planning. We don’t stop every quarter and we don’t start from scratch. We solve problems. Every sprint, every day. We don’t build big plans based on poor estimates and wild guesses. We keep looking for the best way to hit our objectives, whether we are moving away from bad towards good. We keep assessing the value of the initiatives we are running.
Admittedly, my logic above isn’t bulletproof. I might not be solving the right problem; I took some chances based on qualitative interviews and I took one specific report as a sample, because all reports in Mews use the same UX mechanism. Through a mix of qualitative and quantitative insights, we might find a better problem to solve, better definitions of bad and good.
But we need to start somewhere, and we need to do it fast. It took me five minutes to build the report, to find a problem, to think of experiments that are not difficult to code. Not months, not weeks, not even days. Within a day or two, we would be able to learn what works and what does not.
And most probably, we would already move the needle a bit away from bad towards good. And that’s what really matters.
Written by

Jirka Helmich
Jiří (or Jirka) is one of the longest serving members of Mews, having been innovating with us since 2014. He's now our CPO (Chief Product Officer) and is as determined as ever to disrupt hospitality with great products.